What Does "Joint Ventures and Co-Assignees" Show Me?
Within a company dashboard, this will allow you to see information regarding companies that have worked with the company you are looking into.
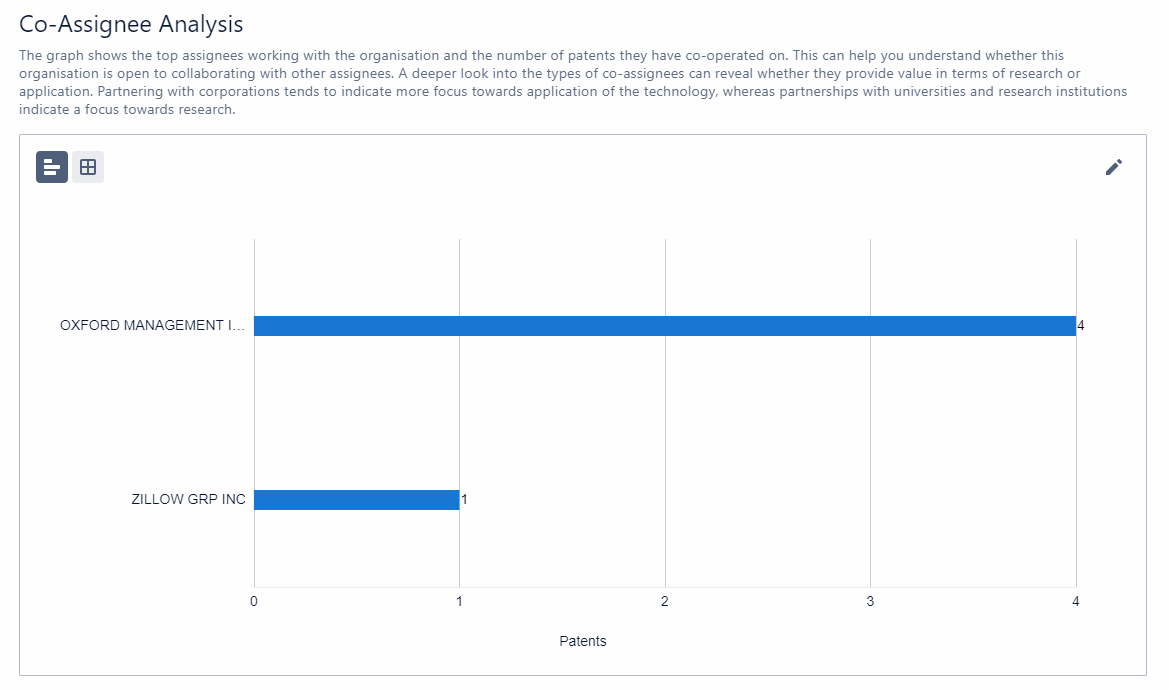
Co-Assignee Partnerships
The Co-Assignee patent portfolio graph shows the number of patents each co-assignee holds with the organization. This is useful for understanding whether an organization has partnered previously and are therefore more likely to be open to collaboration, and in drawing competitive intelligence on the types of organizations they have collaborated with.
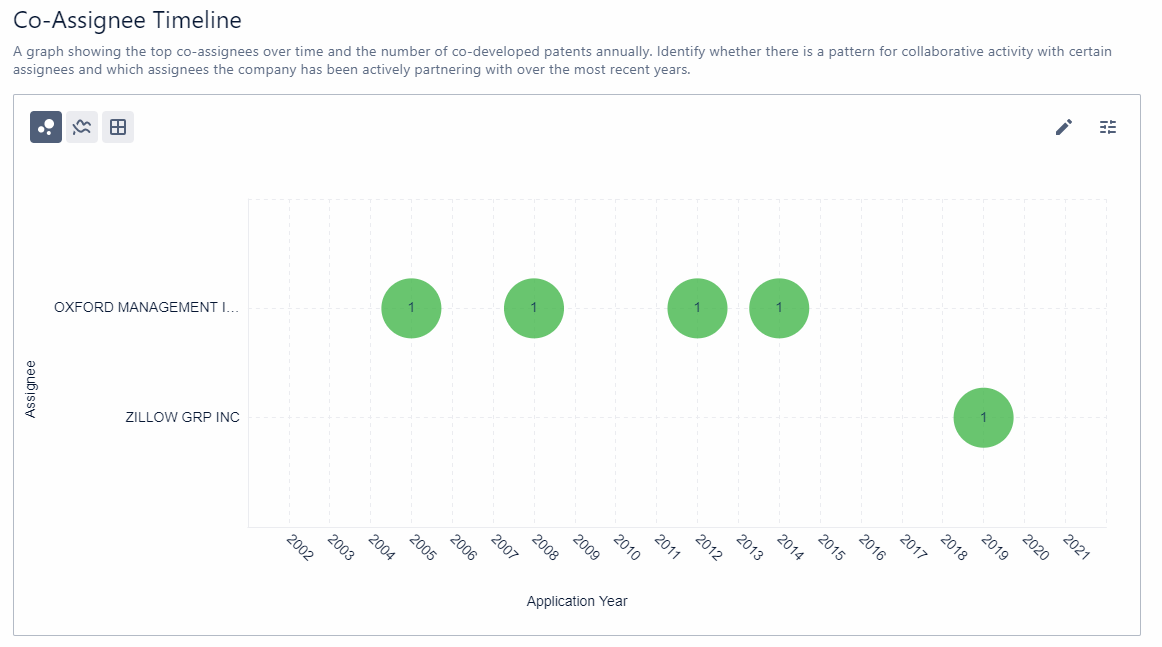
Co-Assignee Timeline
This graph shows the yearly trend of patents published by the organization with the top co-assignees. This is useful for drawing competitive intelligence on who an organization has partnered with in the past and how frequently they aim to establish collaborations. You can also identify whether there is a yearly cycle for collaborative activity and if they have been actively partnering over the last few years.
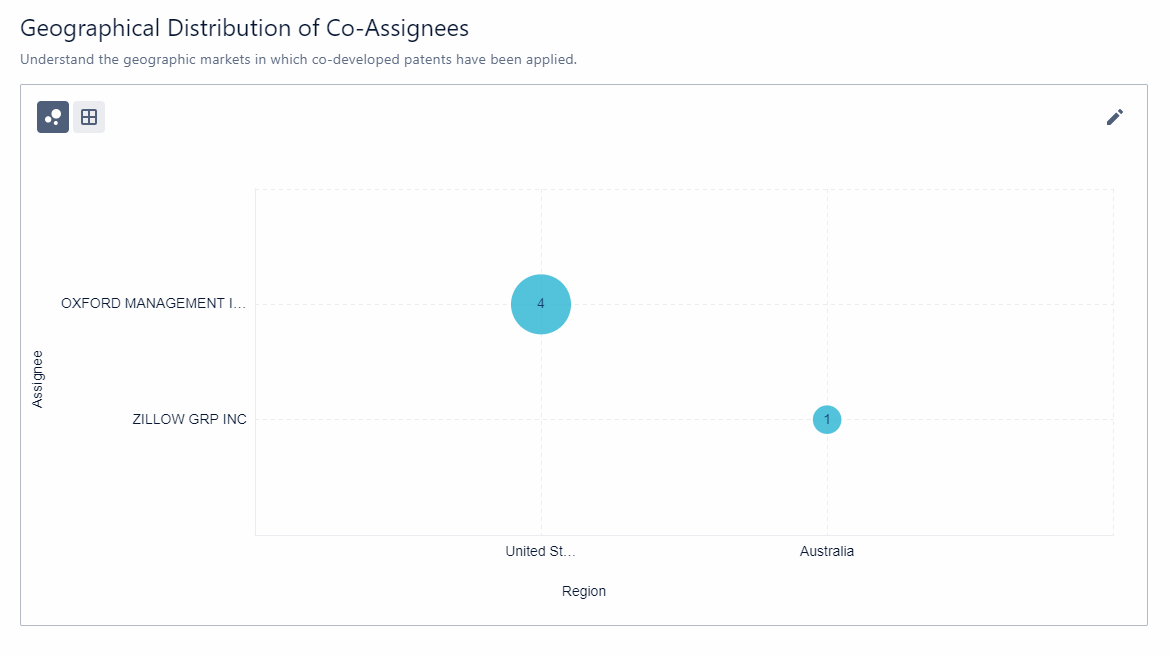
Co-Assignee By Geography
This graph shows the geographic breakdown of patents with the top co-assignees. This is useful in identifying the geographical markets an organization is focusing on and their patenting strategy of co-assignee patents, in terms of geographical coverage.
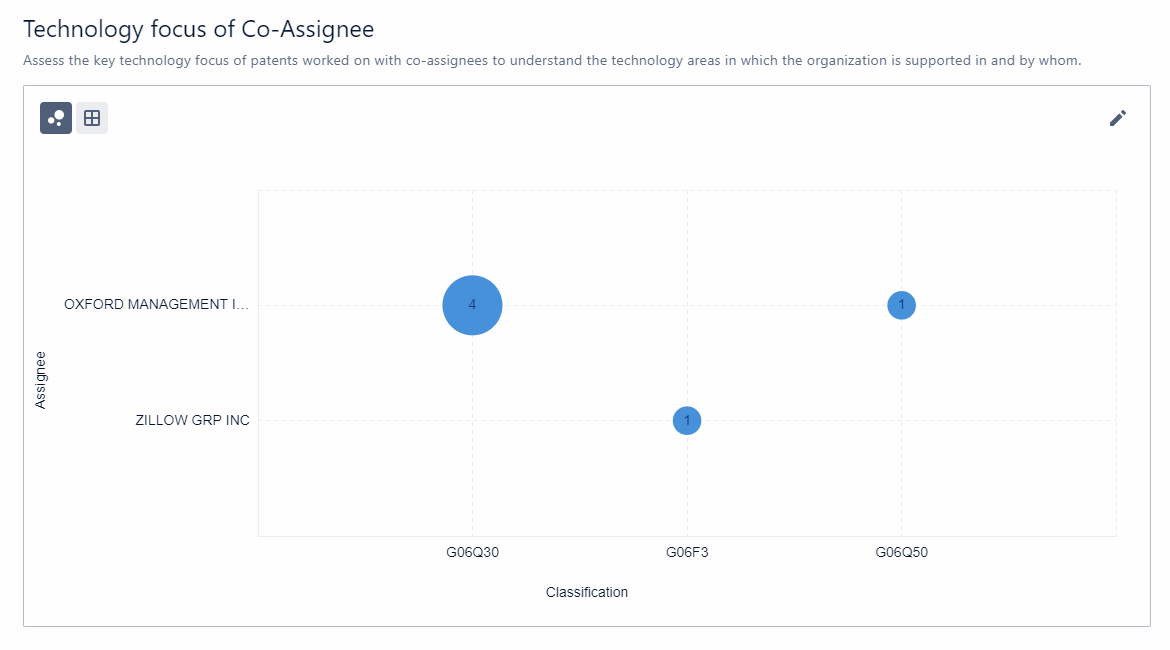
Co-Assignee By Technology
This graph shows the top 10 technology areas the co-assignee patents fall under. This is useful in drawing competitive intelligence on who an organization has partnered with and the industries from which their collaborative partners tend to originate from.

Was this article helpful?
Have more questions? Submit a request
Comments
0 comments
Please sign in to leave a comment.