How Do I Get The Values Used In The “Portfolio Overview” Graph As Numbers Rather Than Percentages?
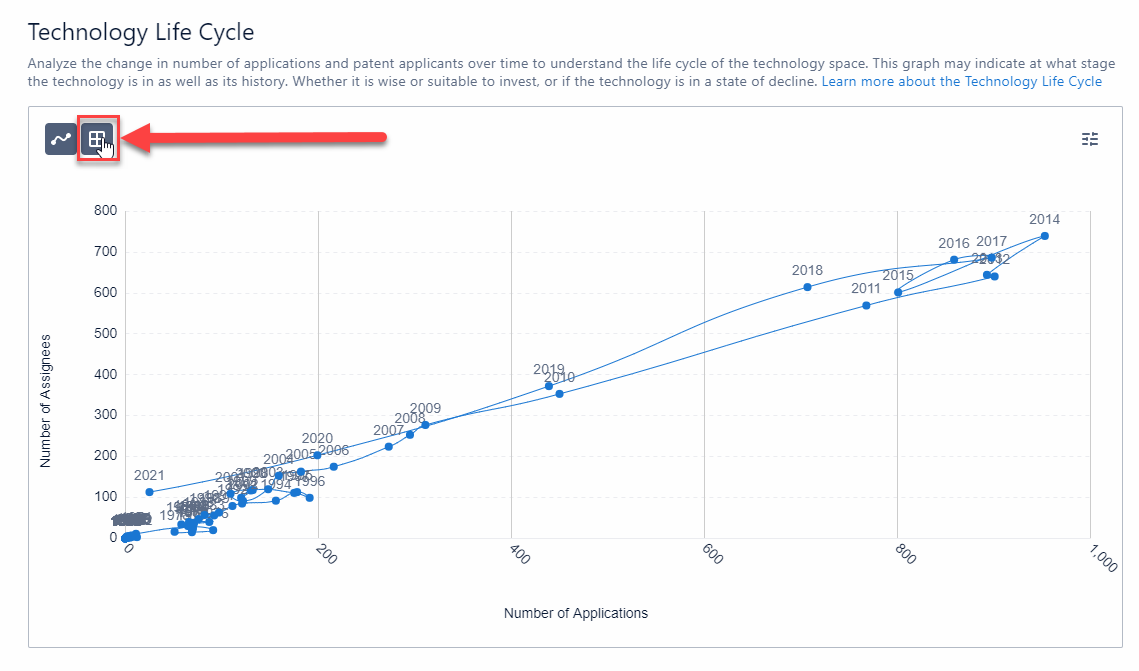
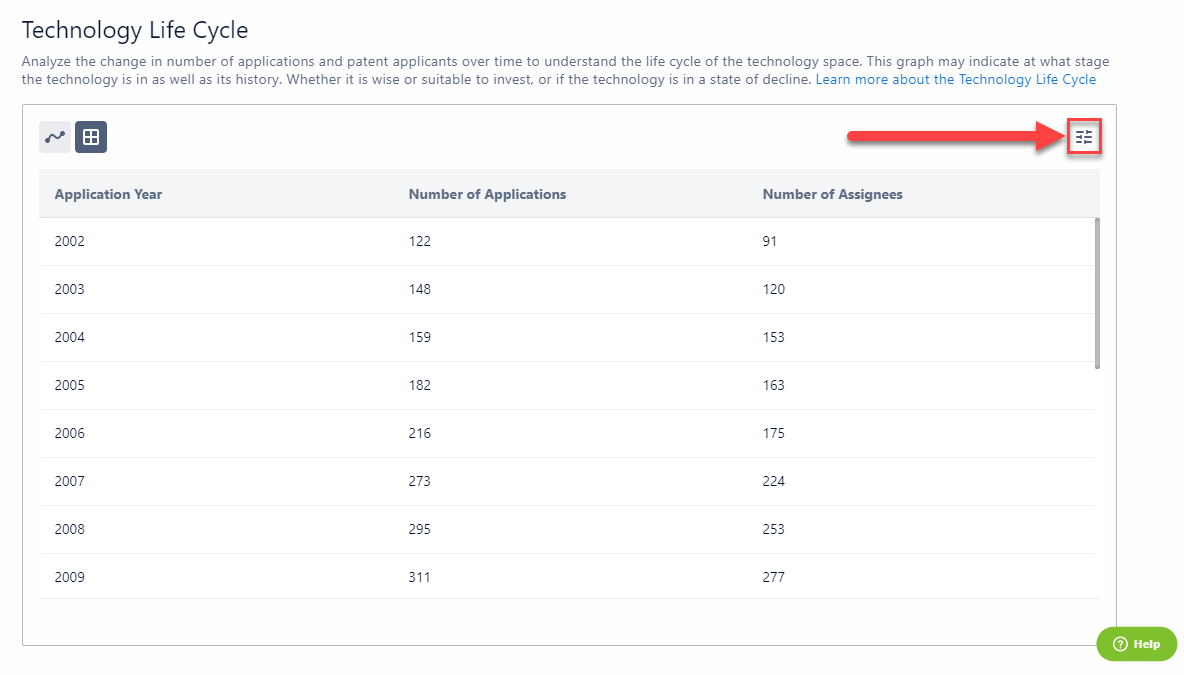
To do this, go to "Innovation Profile" given within any dashboard and you will find the graphs that are in the portfolio overview. By default, these are interactive graphs. To view the table format with values, select the icon that looks like a table as indicated by the arrow below.
On the right side you can also chose the order in which the numbers are displayed.
Was this article helpful?
Have more questions? Submit a request
Comments
0 comments
Please sign in to leave a comment.