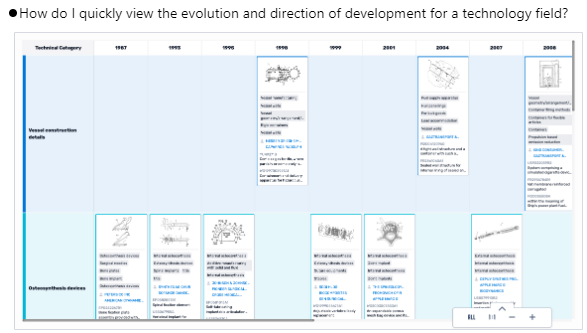
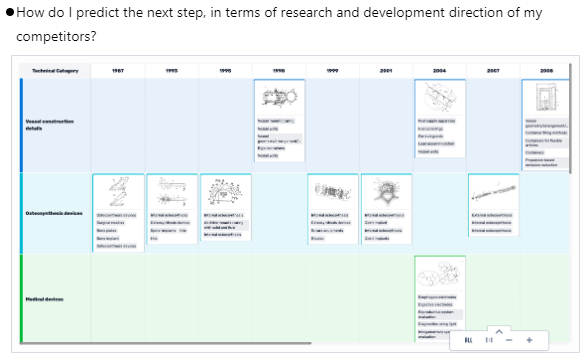
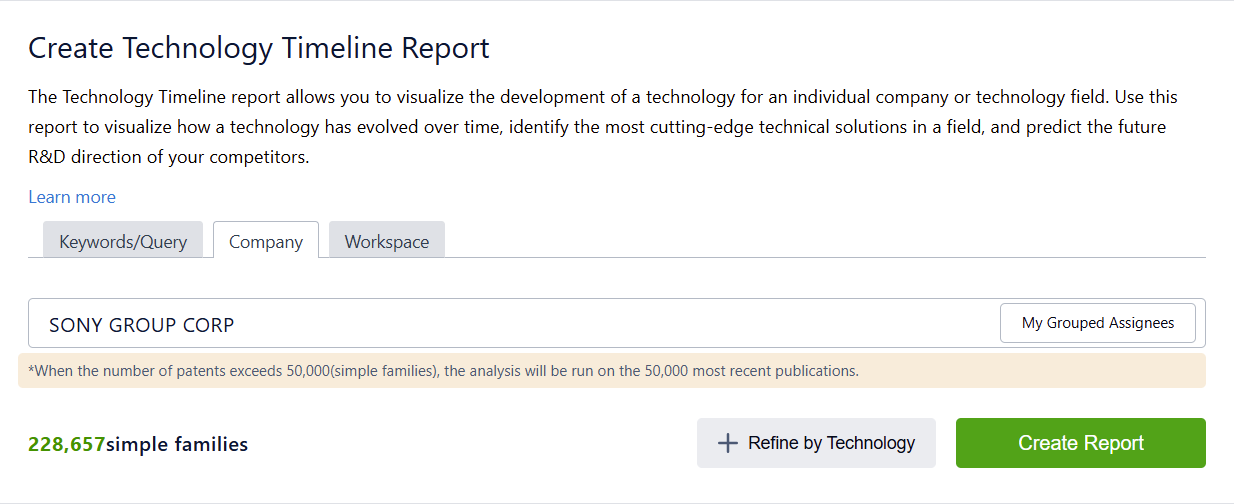
The Technology Timeline report allows you to visualize the development of a technology for an individual company or technology field. Use this report to visualize how a technology has evolved over time, identify the most cutting-edge technical solutions in a field, and predict the future R&D direction of your competitors.
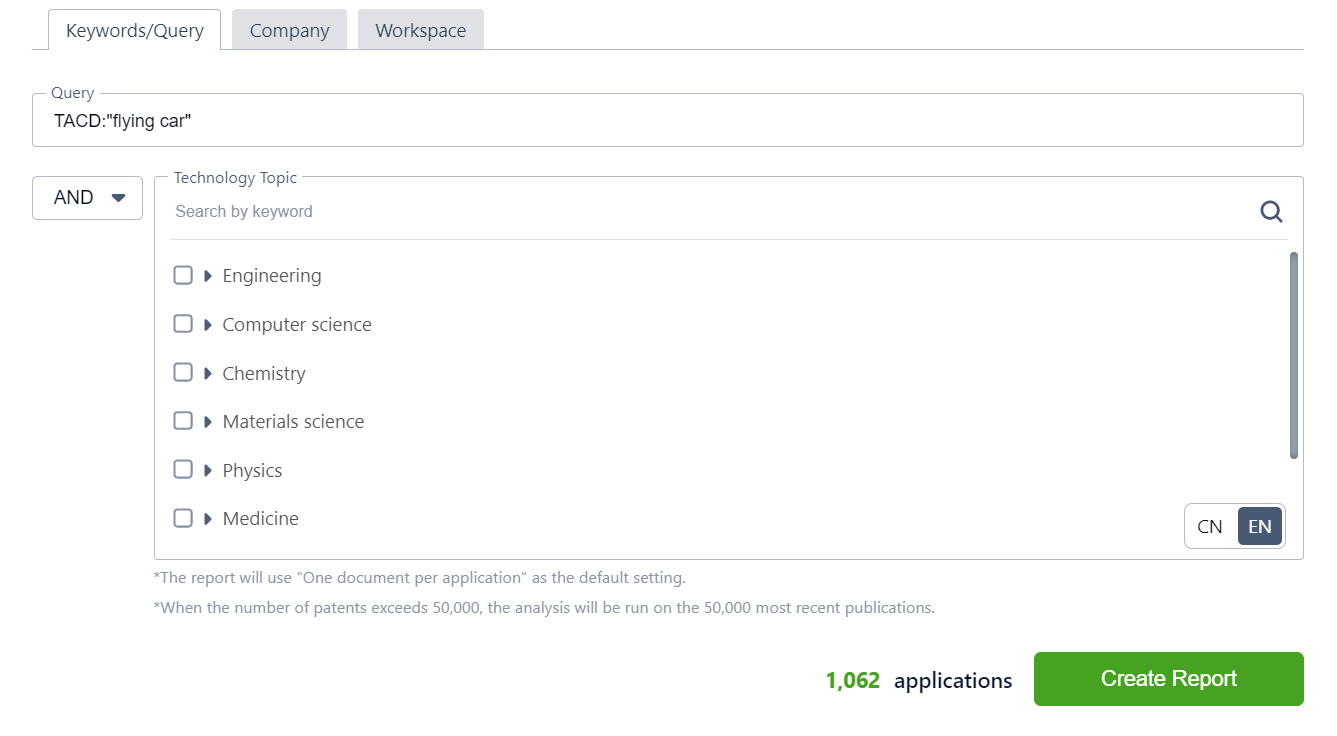
To create a Technology timeline based on a query, simply select the "Keywords/Query" tab, and enter your search string. You are also able to expand or refine using technology topics.
To create a Technology timeline based on a certain company, select the "Company" tab, and enter a company name. You will be presented with suggestions matching your search, click on one of the available suggestions, and then on "Create Report".
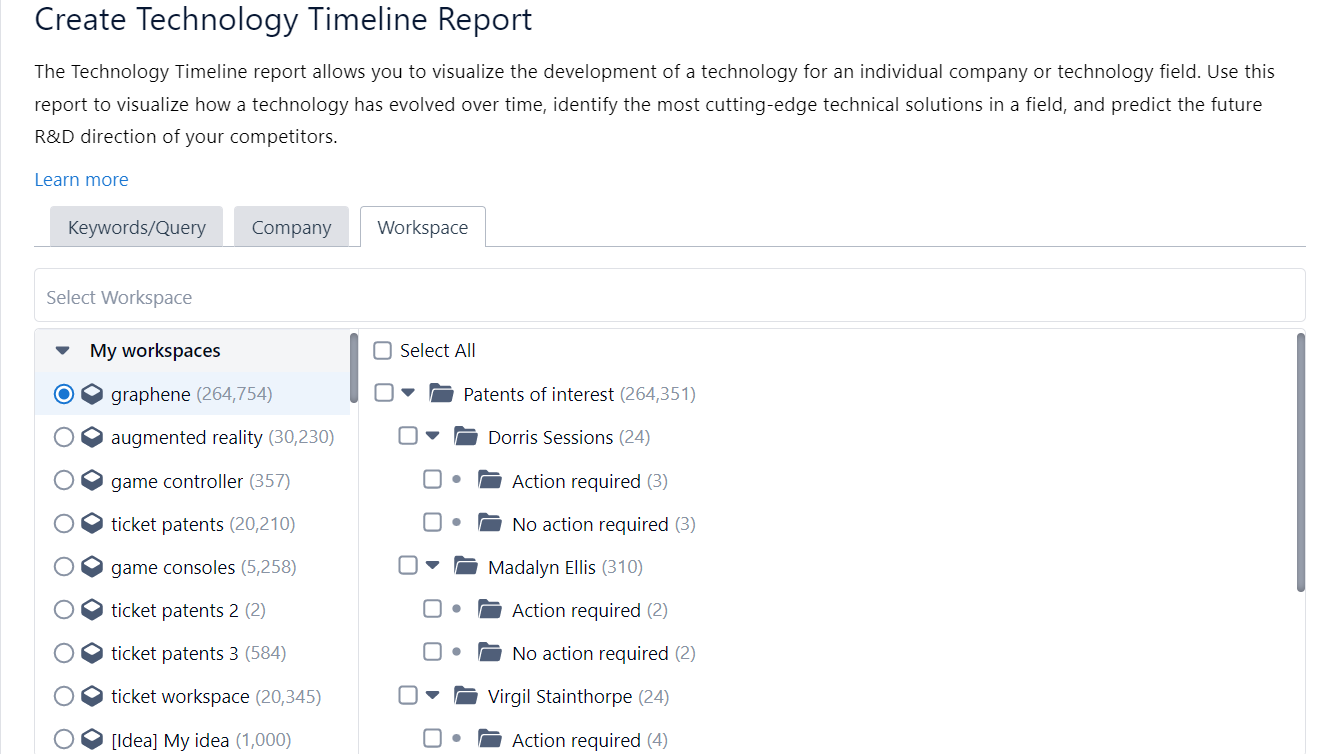
You can now also create a Technology timeline based on your list in your own or your shared Workspace(s). To do this, simple click the "Workspace" tab and select the folder you would like to have displayed on a timeline. Once you are happy with your selection, simply click "Create Report".
You may want to analyze a lot of data not related to one specific kind of technology, therefore, the report now generates multiple levels for the Technology Timeline based on the Application Domain. Although the map is generated automatically, you can manually adjust the level of the application domain by using the slider to make it more general or broader.
Timelines are generated using a calculation that considers the following indicators: Number of Patent Citations, Patsnap family count, Infringement lawsuits, Top assignees, Patent Valuation, and more. The data is clustered, then split into different technical categories. Key patents from each year are identified within the technical category, extracted, and displayed on the timeline based on their application date.
By clicking on Manage display (eye icon), you are able to edit what's on each card, you can change the years in the timeline, and you can change the application domains that are used.
You can also customize the labels of the technology timeline of a particular year in order to add or remove details - as well as select another application picture if one is available in the documentation. To do so, hover with your mouse above the year you would like to edit, and click on the edit button that will appear on the top right:
You are able to edit the description, select the patents to be displayed and the patent the display picture comes from.
This report will use "One document per application" as the default setting, and it supports analysis for up to 10,000 patents. You are also able to refresh the data, add new patents, export, delete and change the zooming settings for the report.


Comments
0 comments
Please sign in to leave a comment.