Product Update: December 2020
In December we've added two of our most highly requested features and other general improvements to the platform, check out the details below:
Analyze the data using charts
Various charts have been implemented in Discovery so that you can analyze the vast amount of data to derive meaningful insight. So far, the charts are available for three data types: Patents, Papers, and VC Investments.
Once you have conducted a search and reached one of the data list pages, e.g. Papers, on the right corner a new tab has been added called "Analysis".
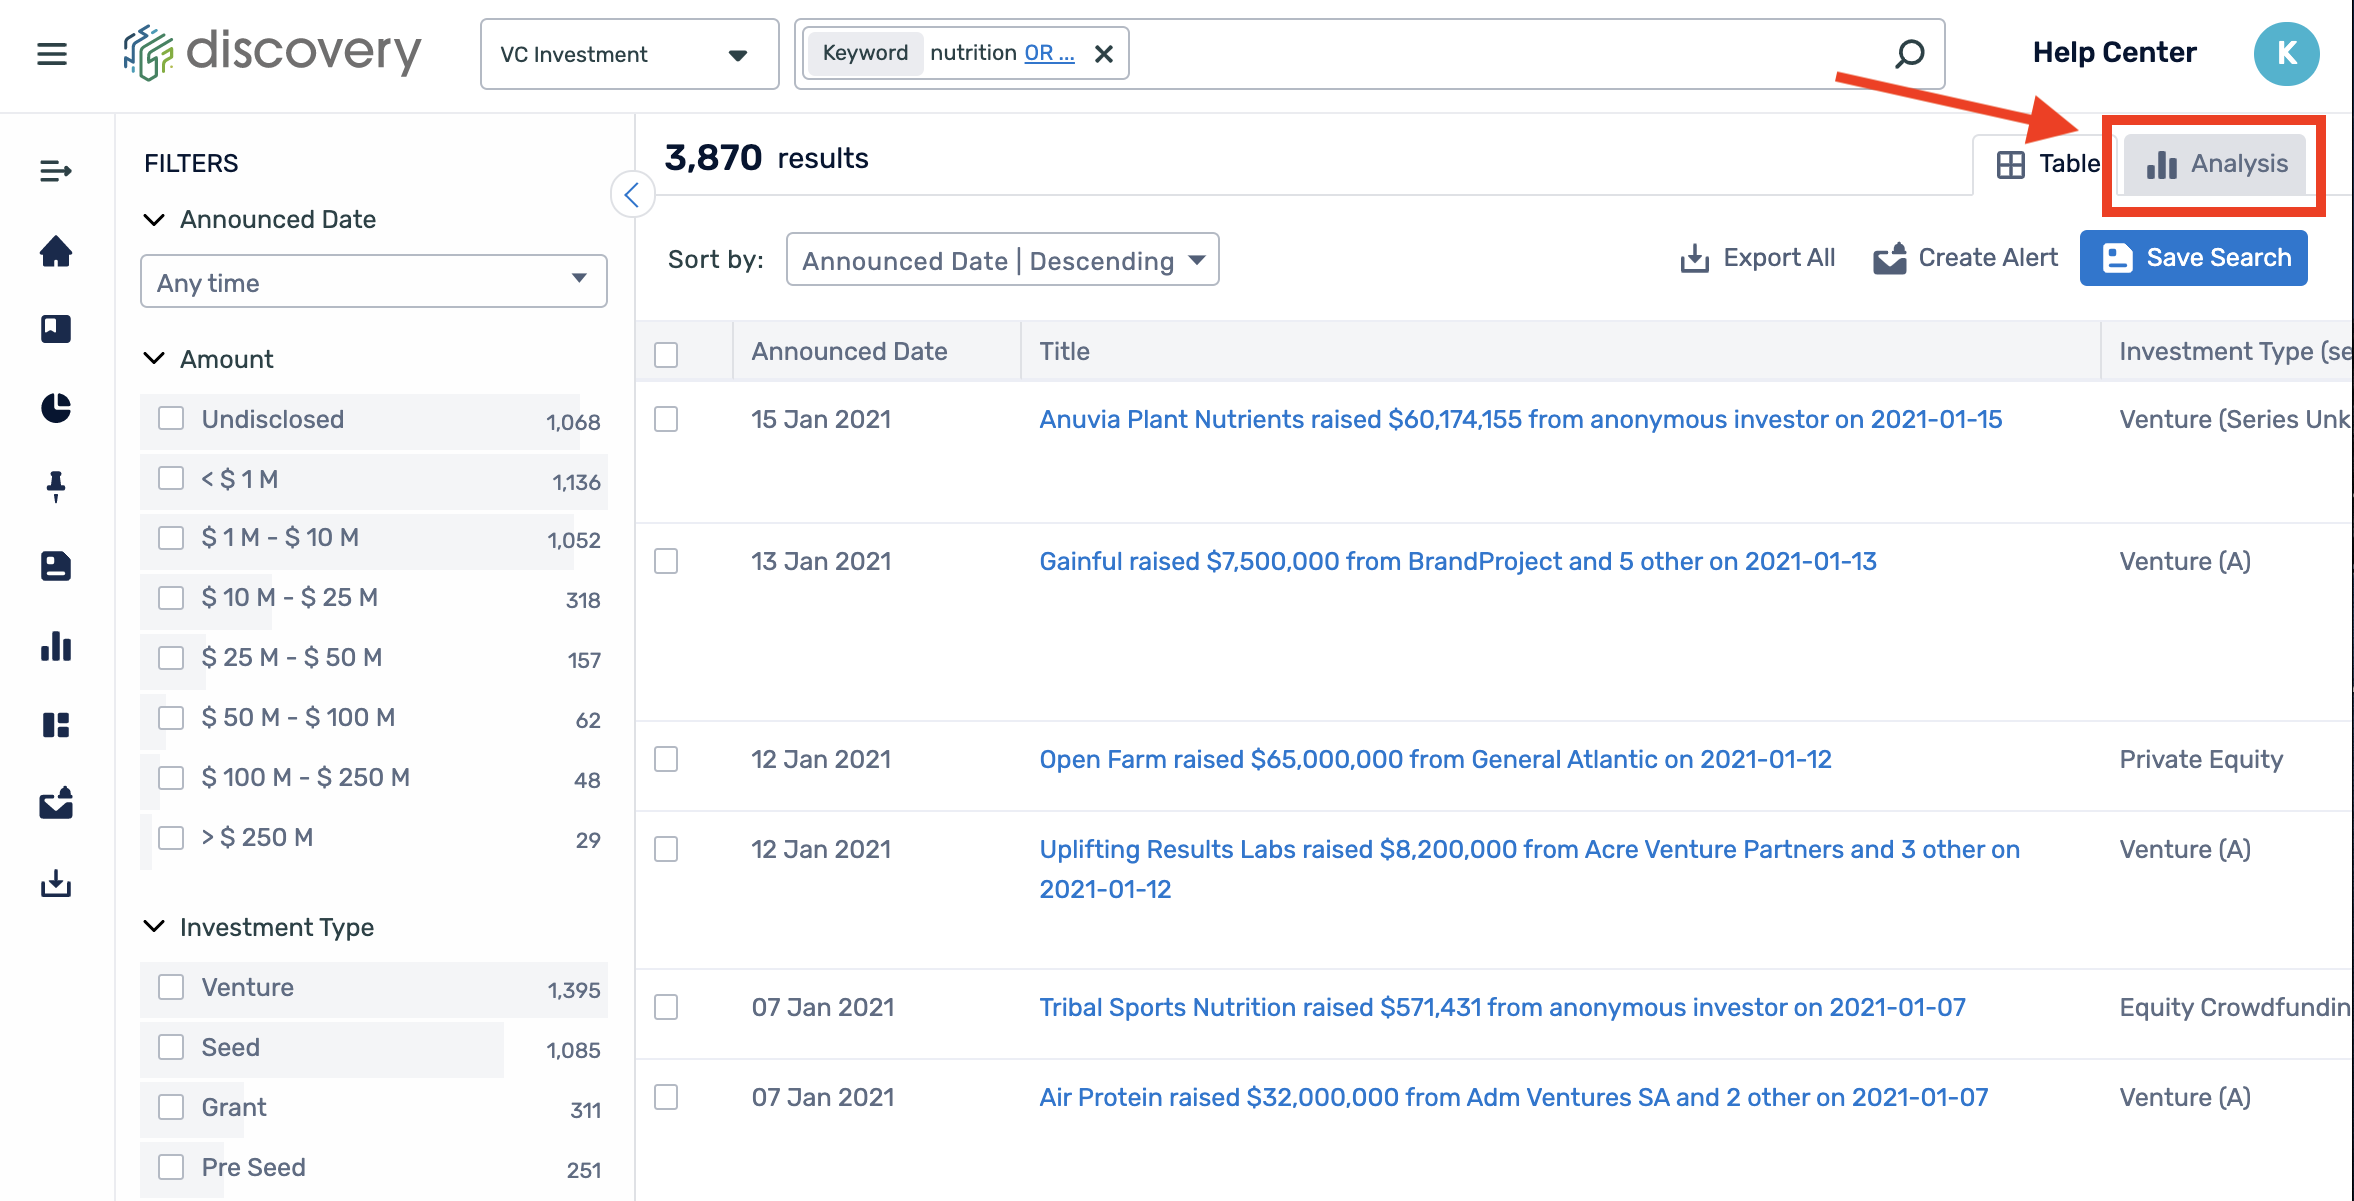
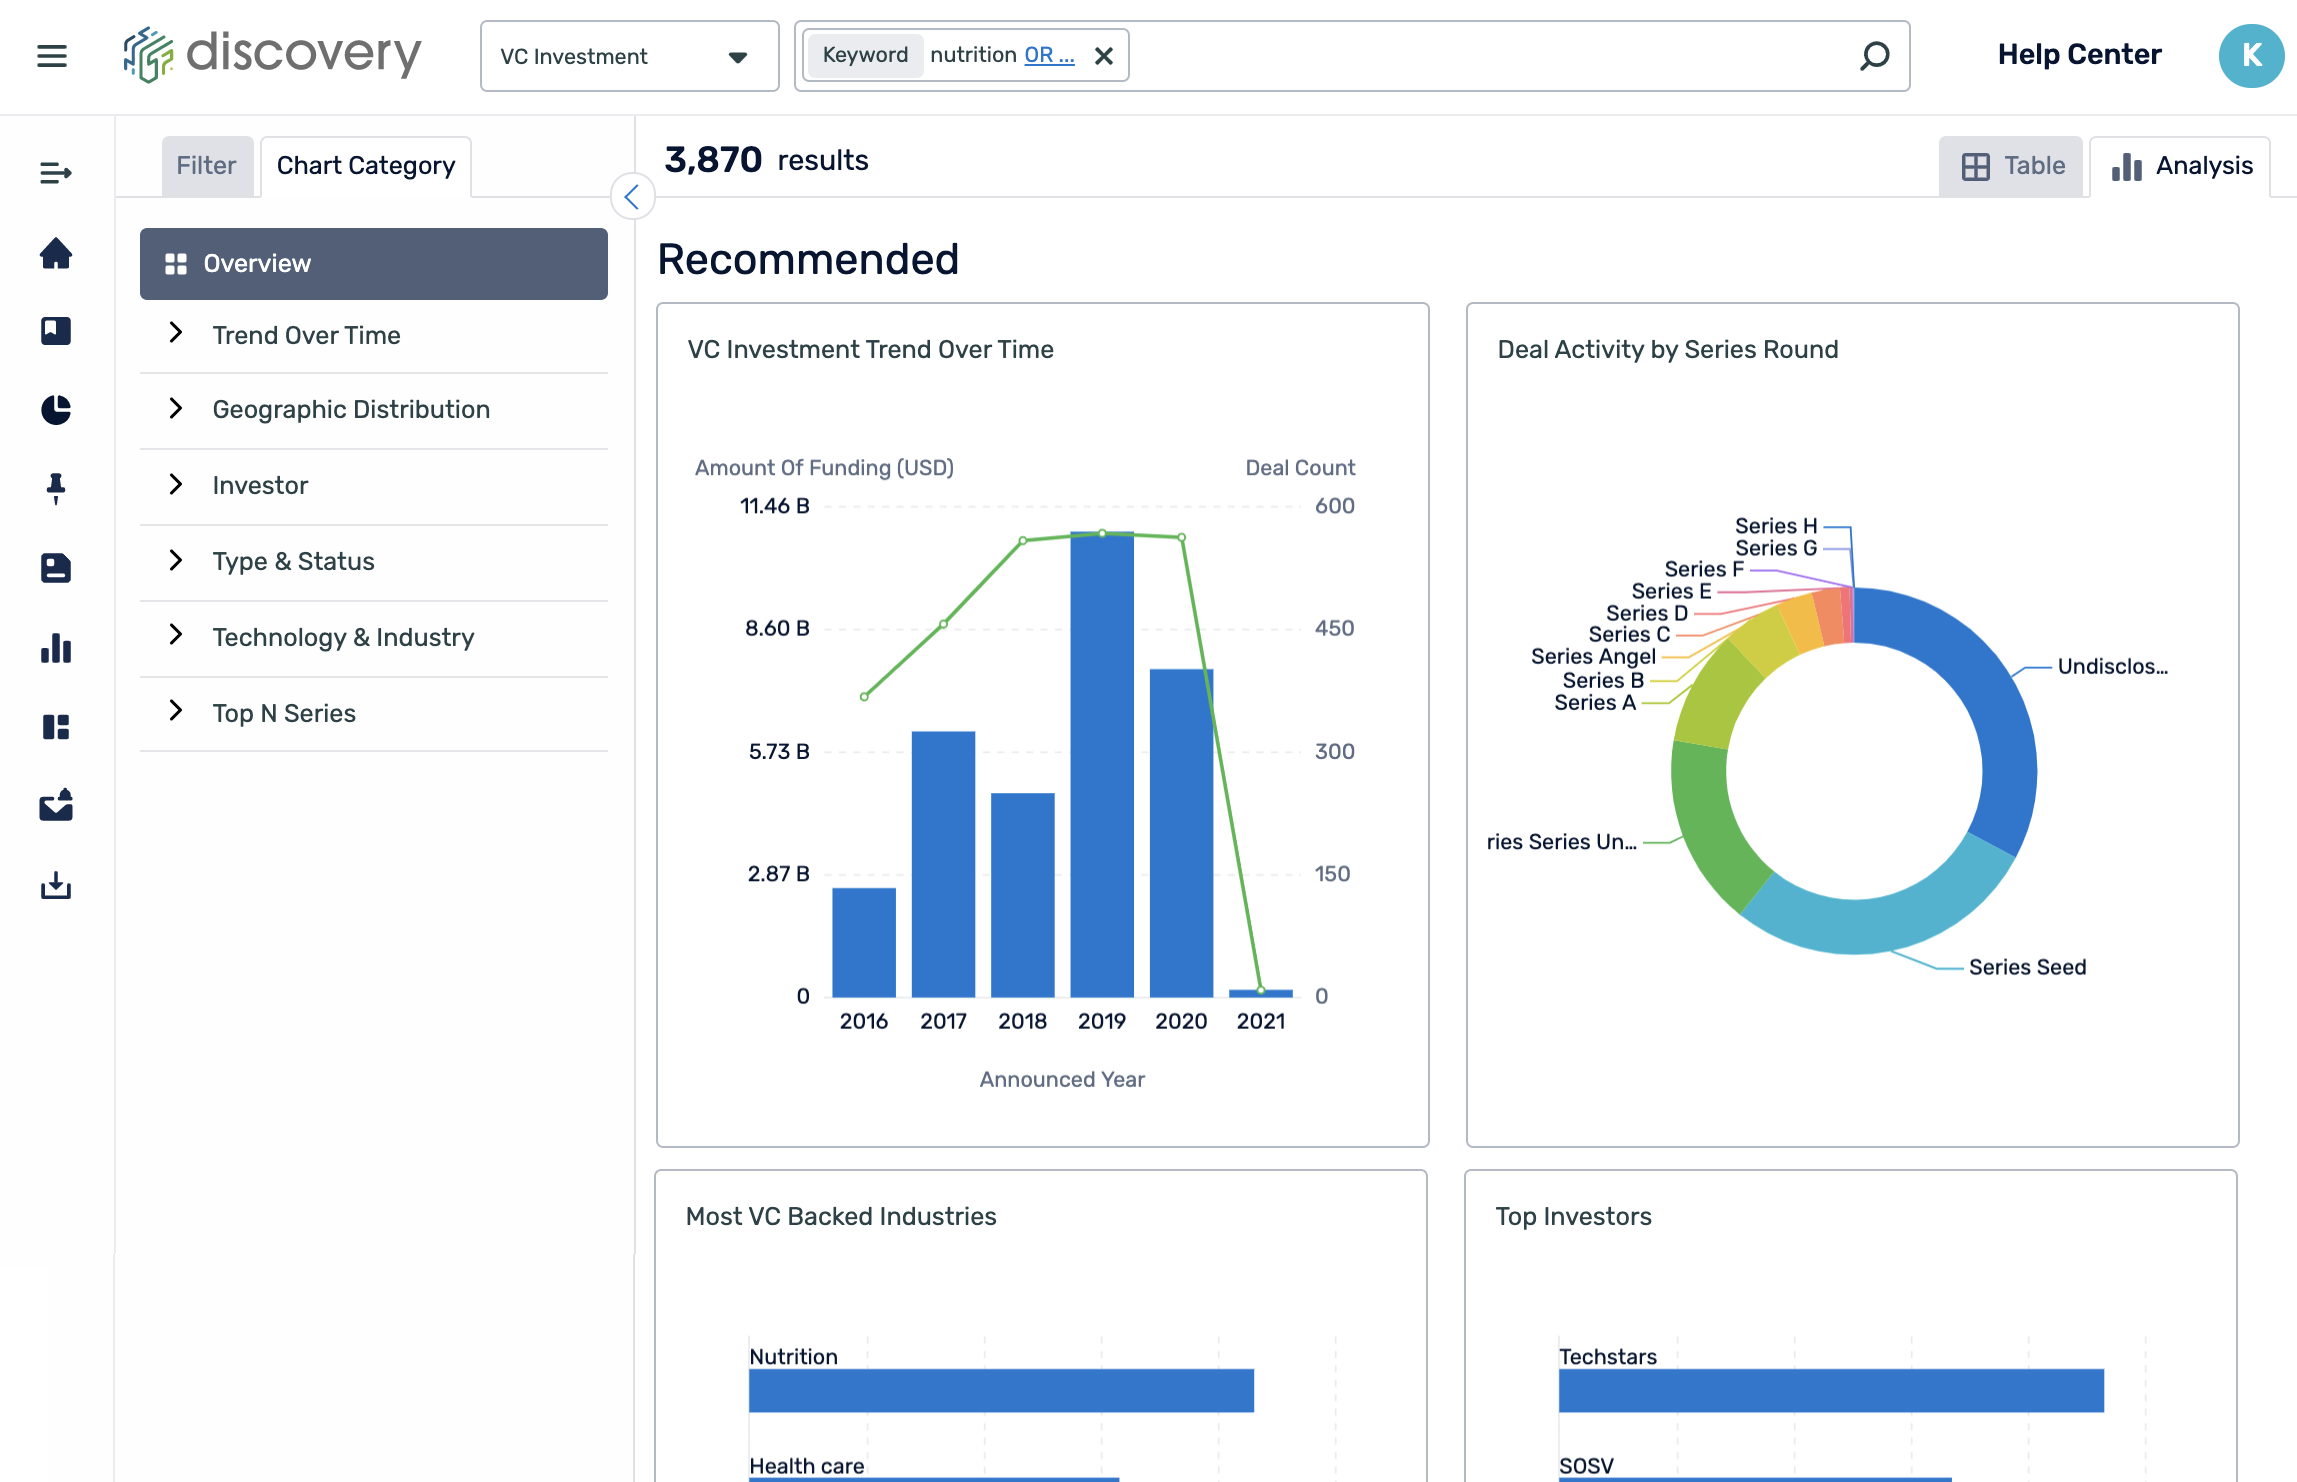
Clicking the "Analysis" tab will switch the view to an overview of six recommended charts for this data type, all the charts presented are based on your search query and any filters that have been selected.
From here, you can click on a chart to expand it and view the details.
List of charts available
Data type: Patents
- Application and Grant Trend
- Application Trend in Top Countries
- Top Countries
- Top Organizations
- Simple Legal Status
Data type: Papers
- Academic Publication Geographic Distribution
- Academic Publication Trend Over Time
- Academic Publication Trend Over Time by Type
- Top Affiliations
- Top Fields of Study Word Cloud
- Top Journals
Data type: VC Investment
- VC Investment Trend Over Time
- Most VC Backed Industries
- Top Investors
- Deal Activity by Country (Amount)
- Deal Activity by Country (Count)
- Deal Activity by Investment Type
- Deal Activity by Series Round
Start saving your searches
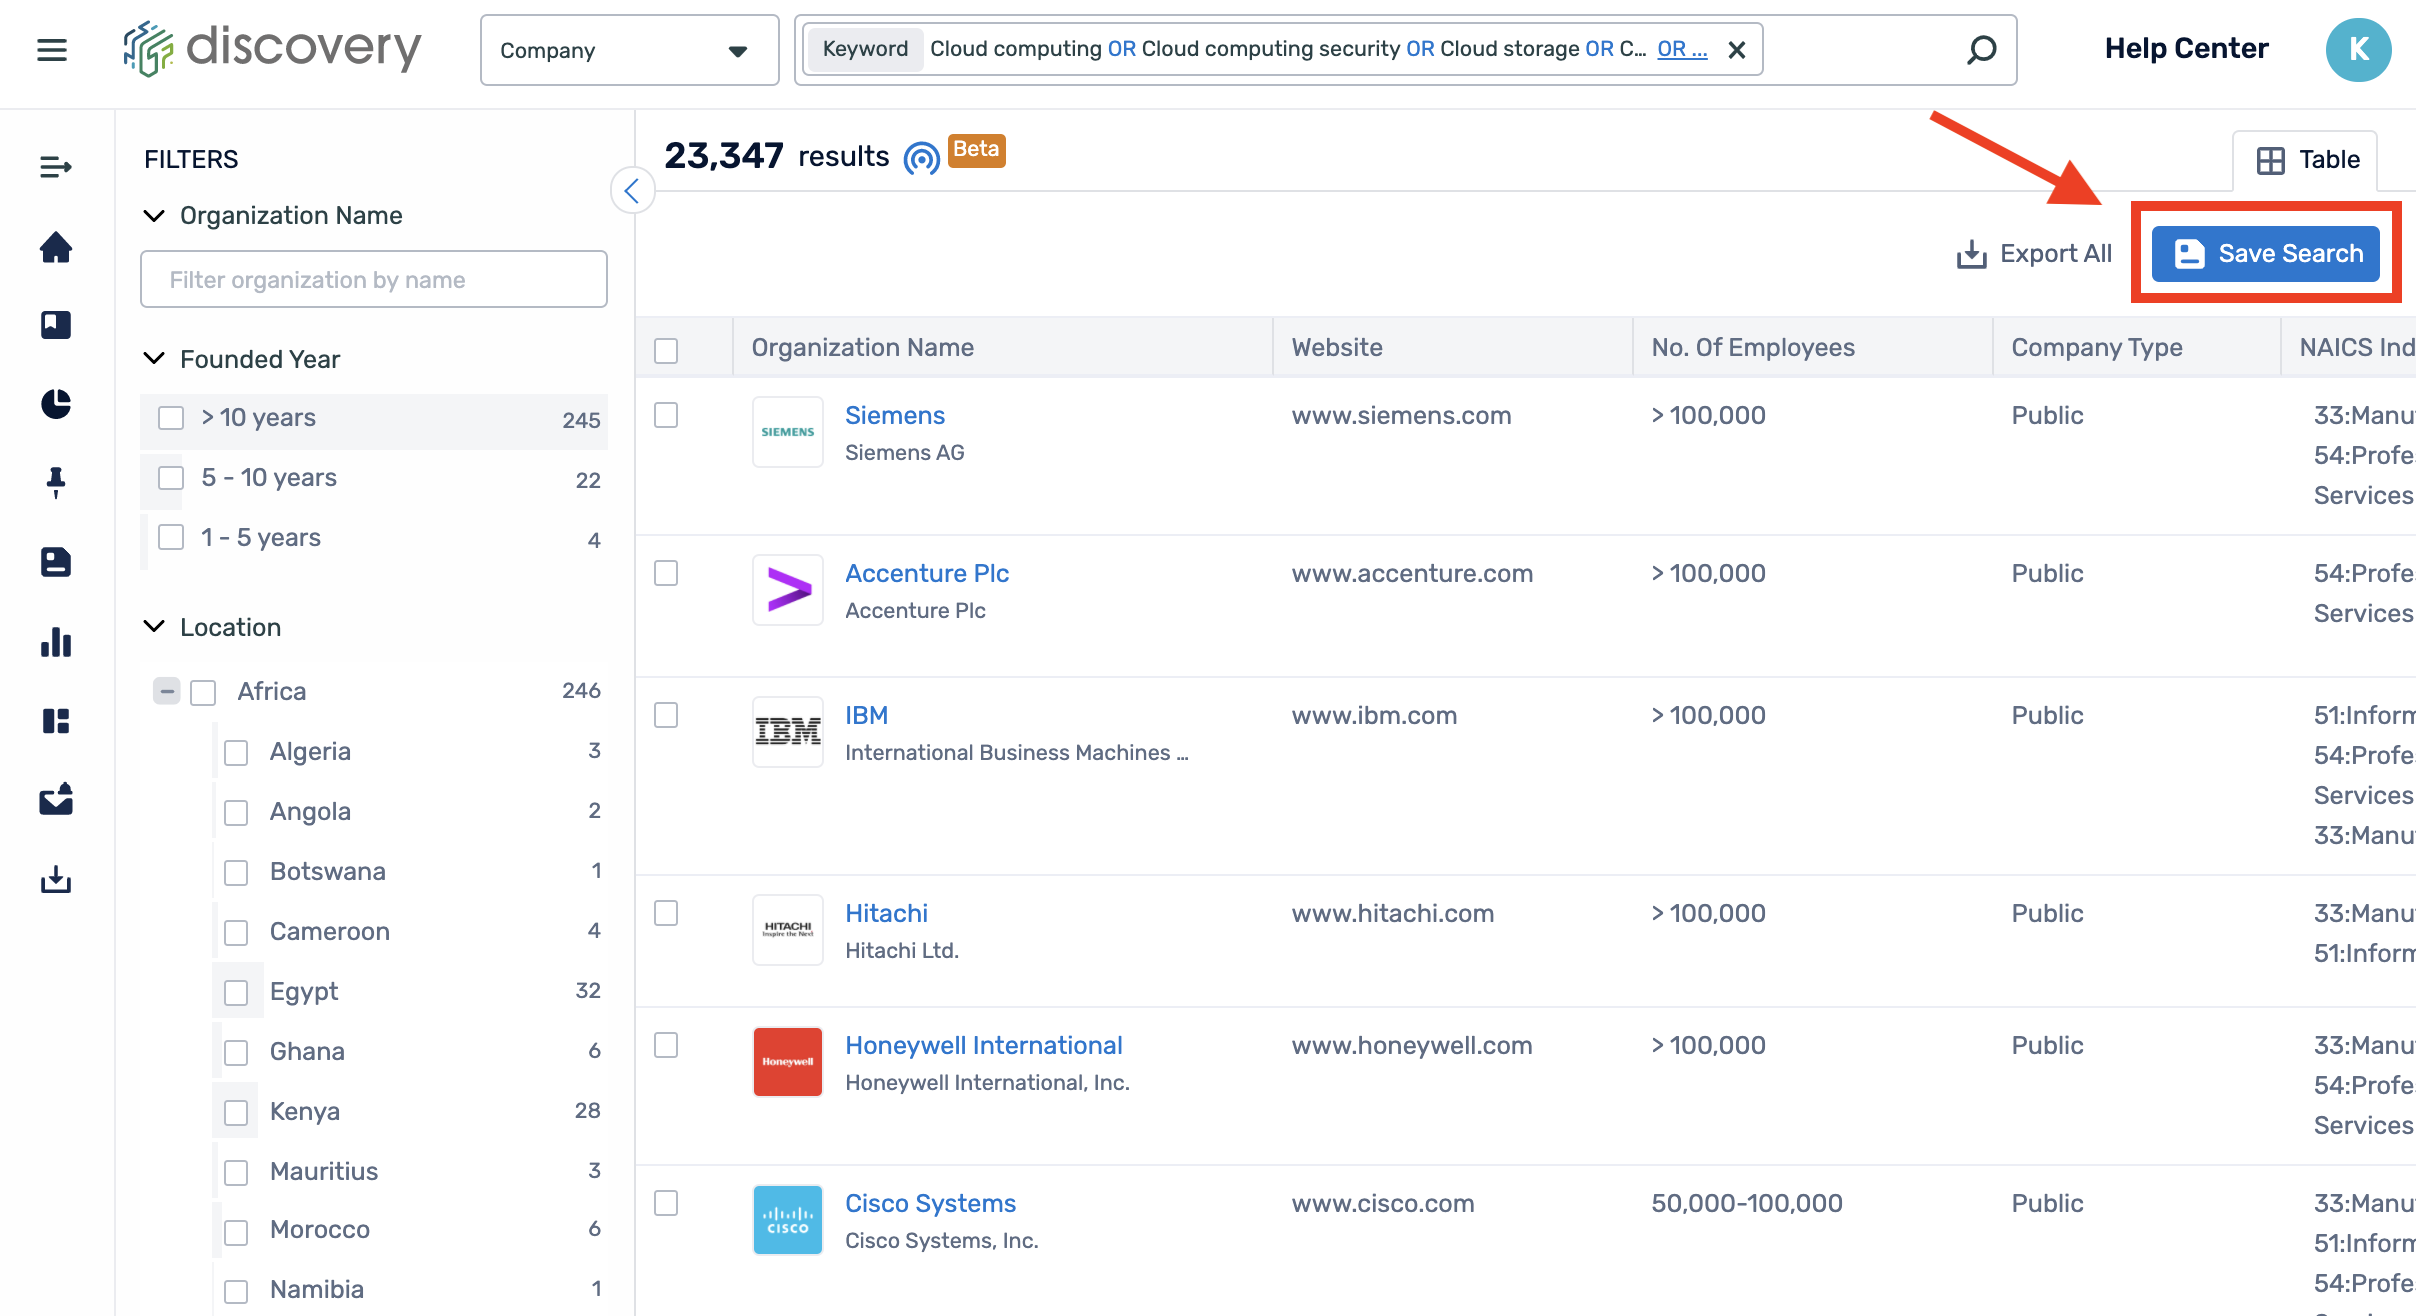
Once you have got a high-quality set of results for a search you have performed, it is likely that you will want to return back to it later. To keep track of these critical searches, you can now make use of our "Save Search" functionality.
You can find this function once you have performed a search based on a specific data type.
Removal of the data type tech blogs
Was this article helpful?
Have more questions? Submit a request
Comments
0 comments
Please sign in to leave a comment.