


As we enter 2021, we've kicked off the year with a couple of major features added such as the insights dashboard and saving analysis charts, we have also made a number of general improvements too. See the most important updates below:
Saving the charts that interest you most
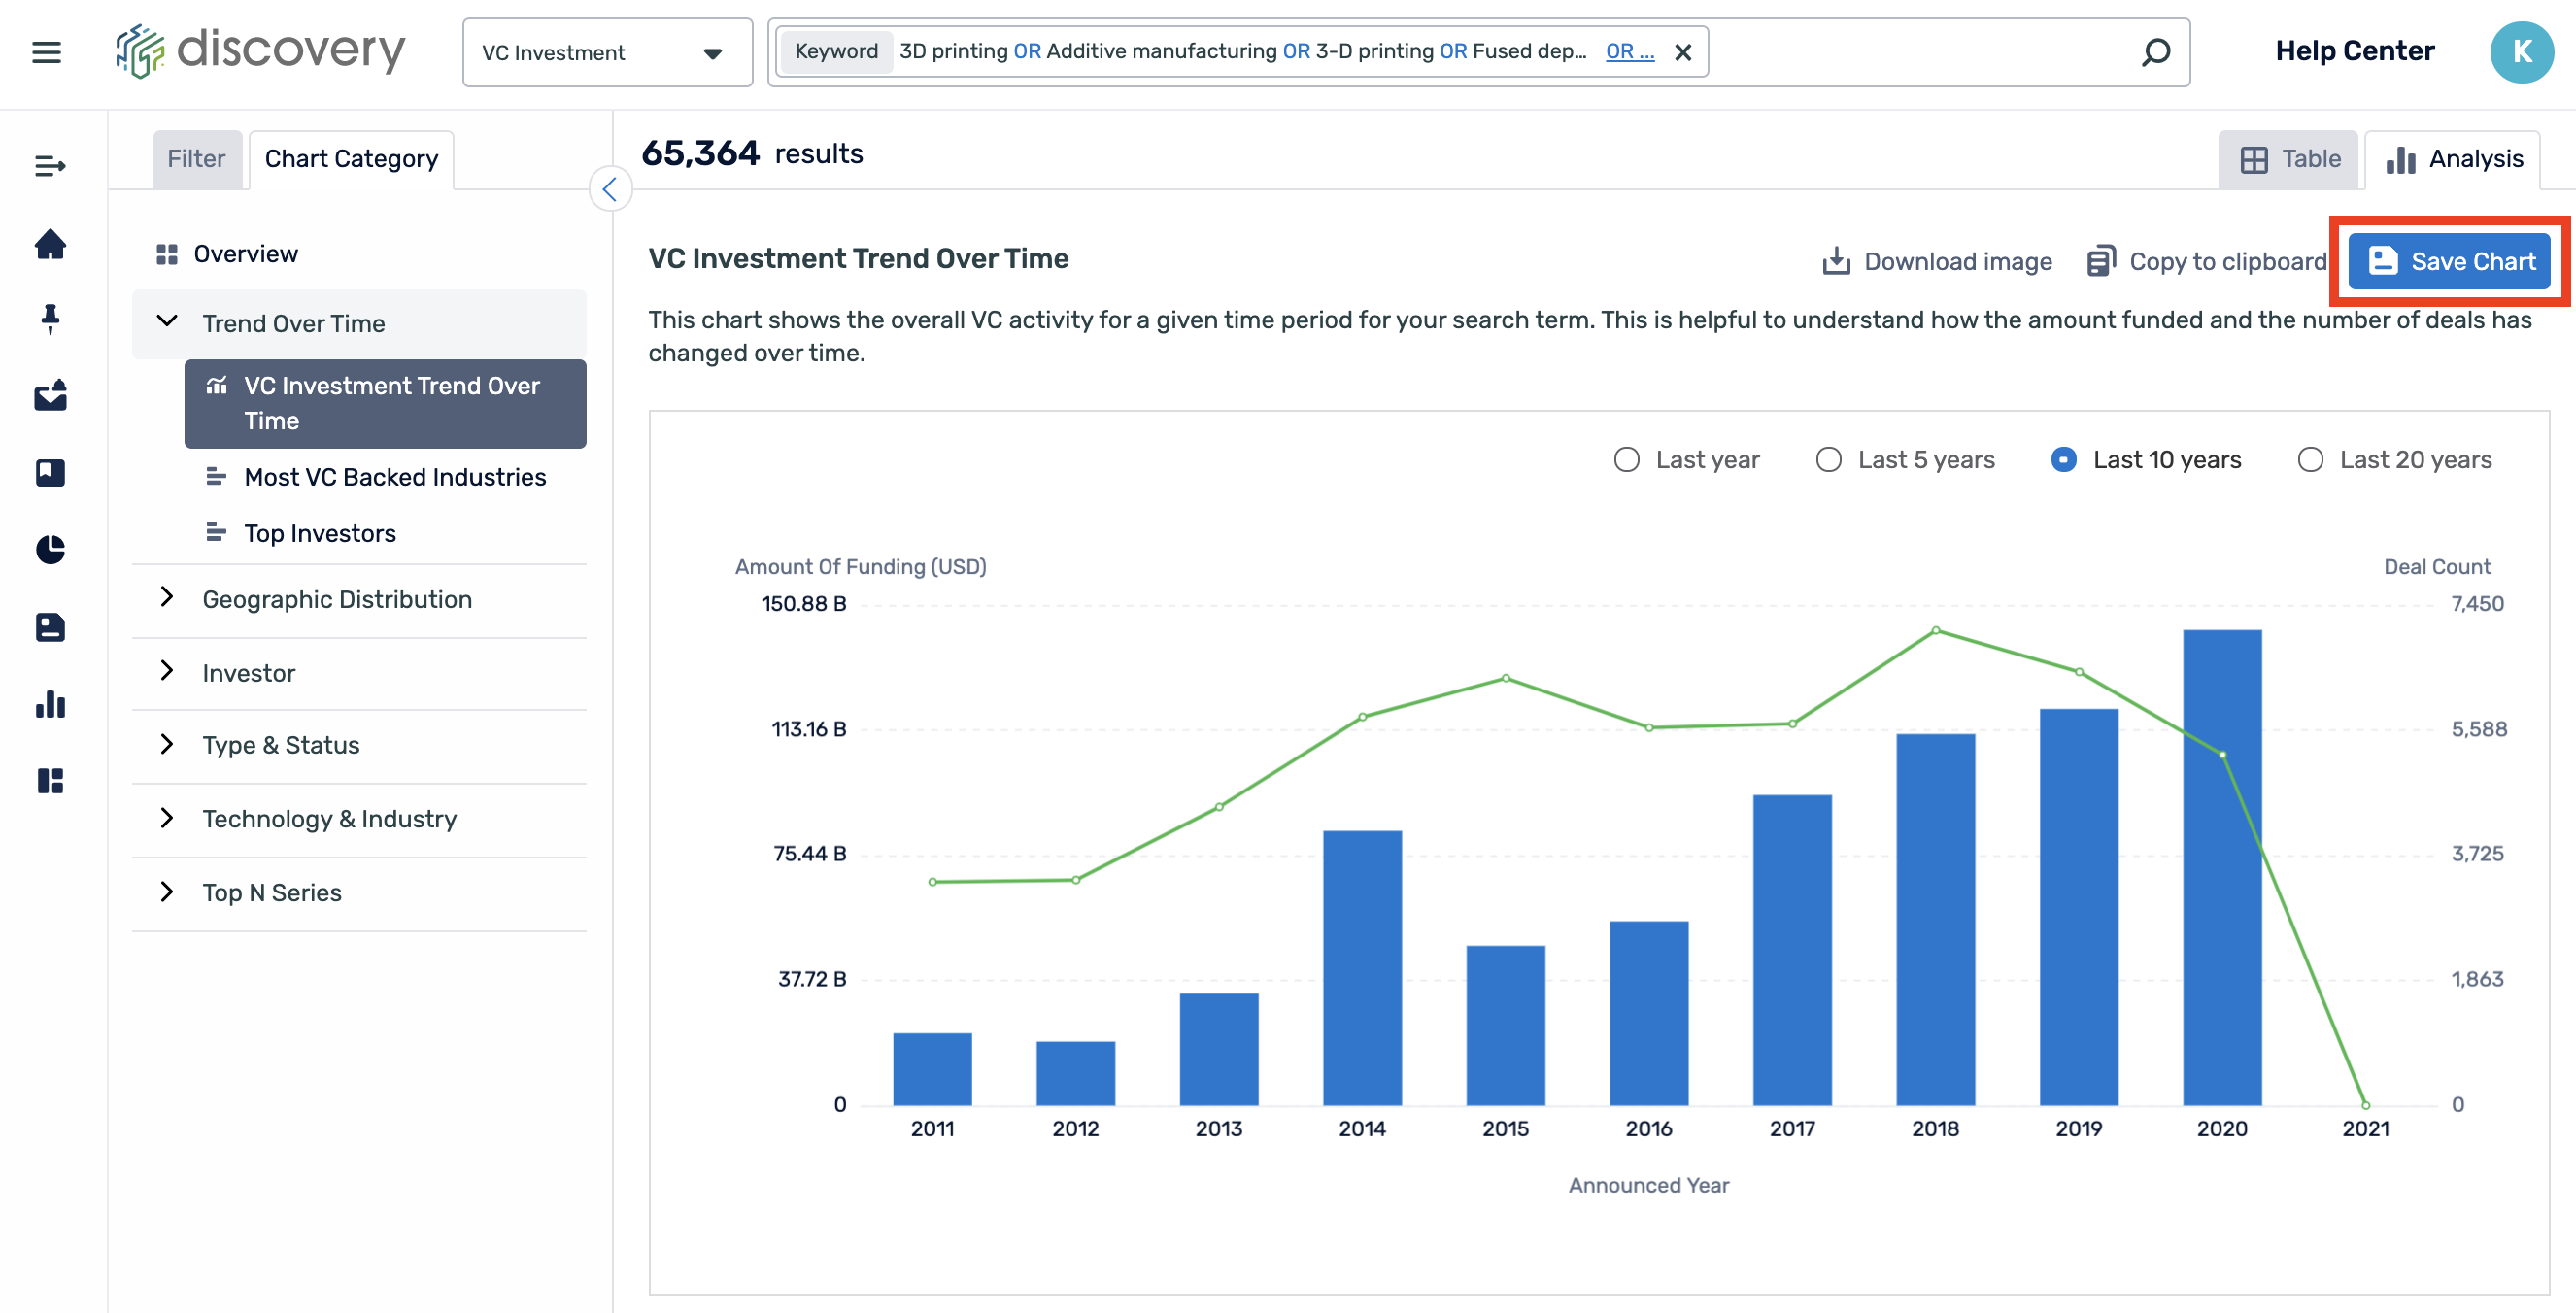
You can now save any analysis chart from the "Analysis" tab in Discovery. Keep track of all your favorite charts in one place.
Once you have found a chart of interest, you can click "Save Chart". Any refinement filters selected will be saved as well as the time range that is selected.
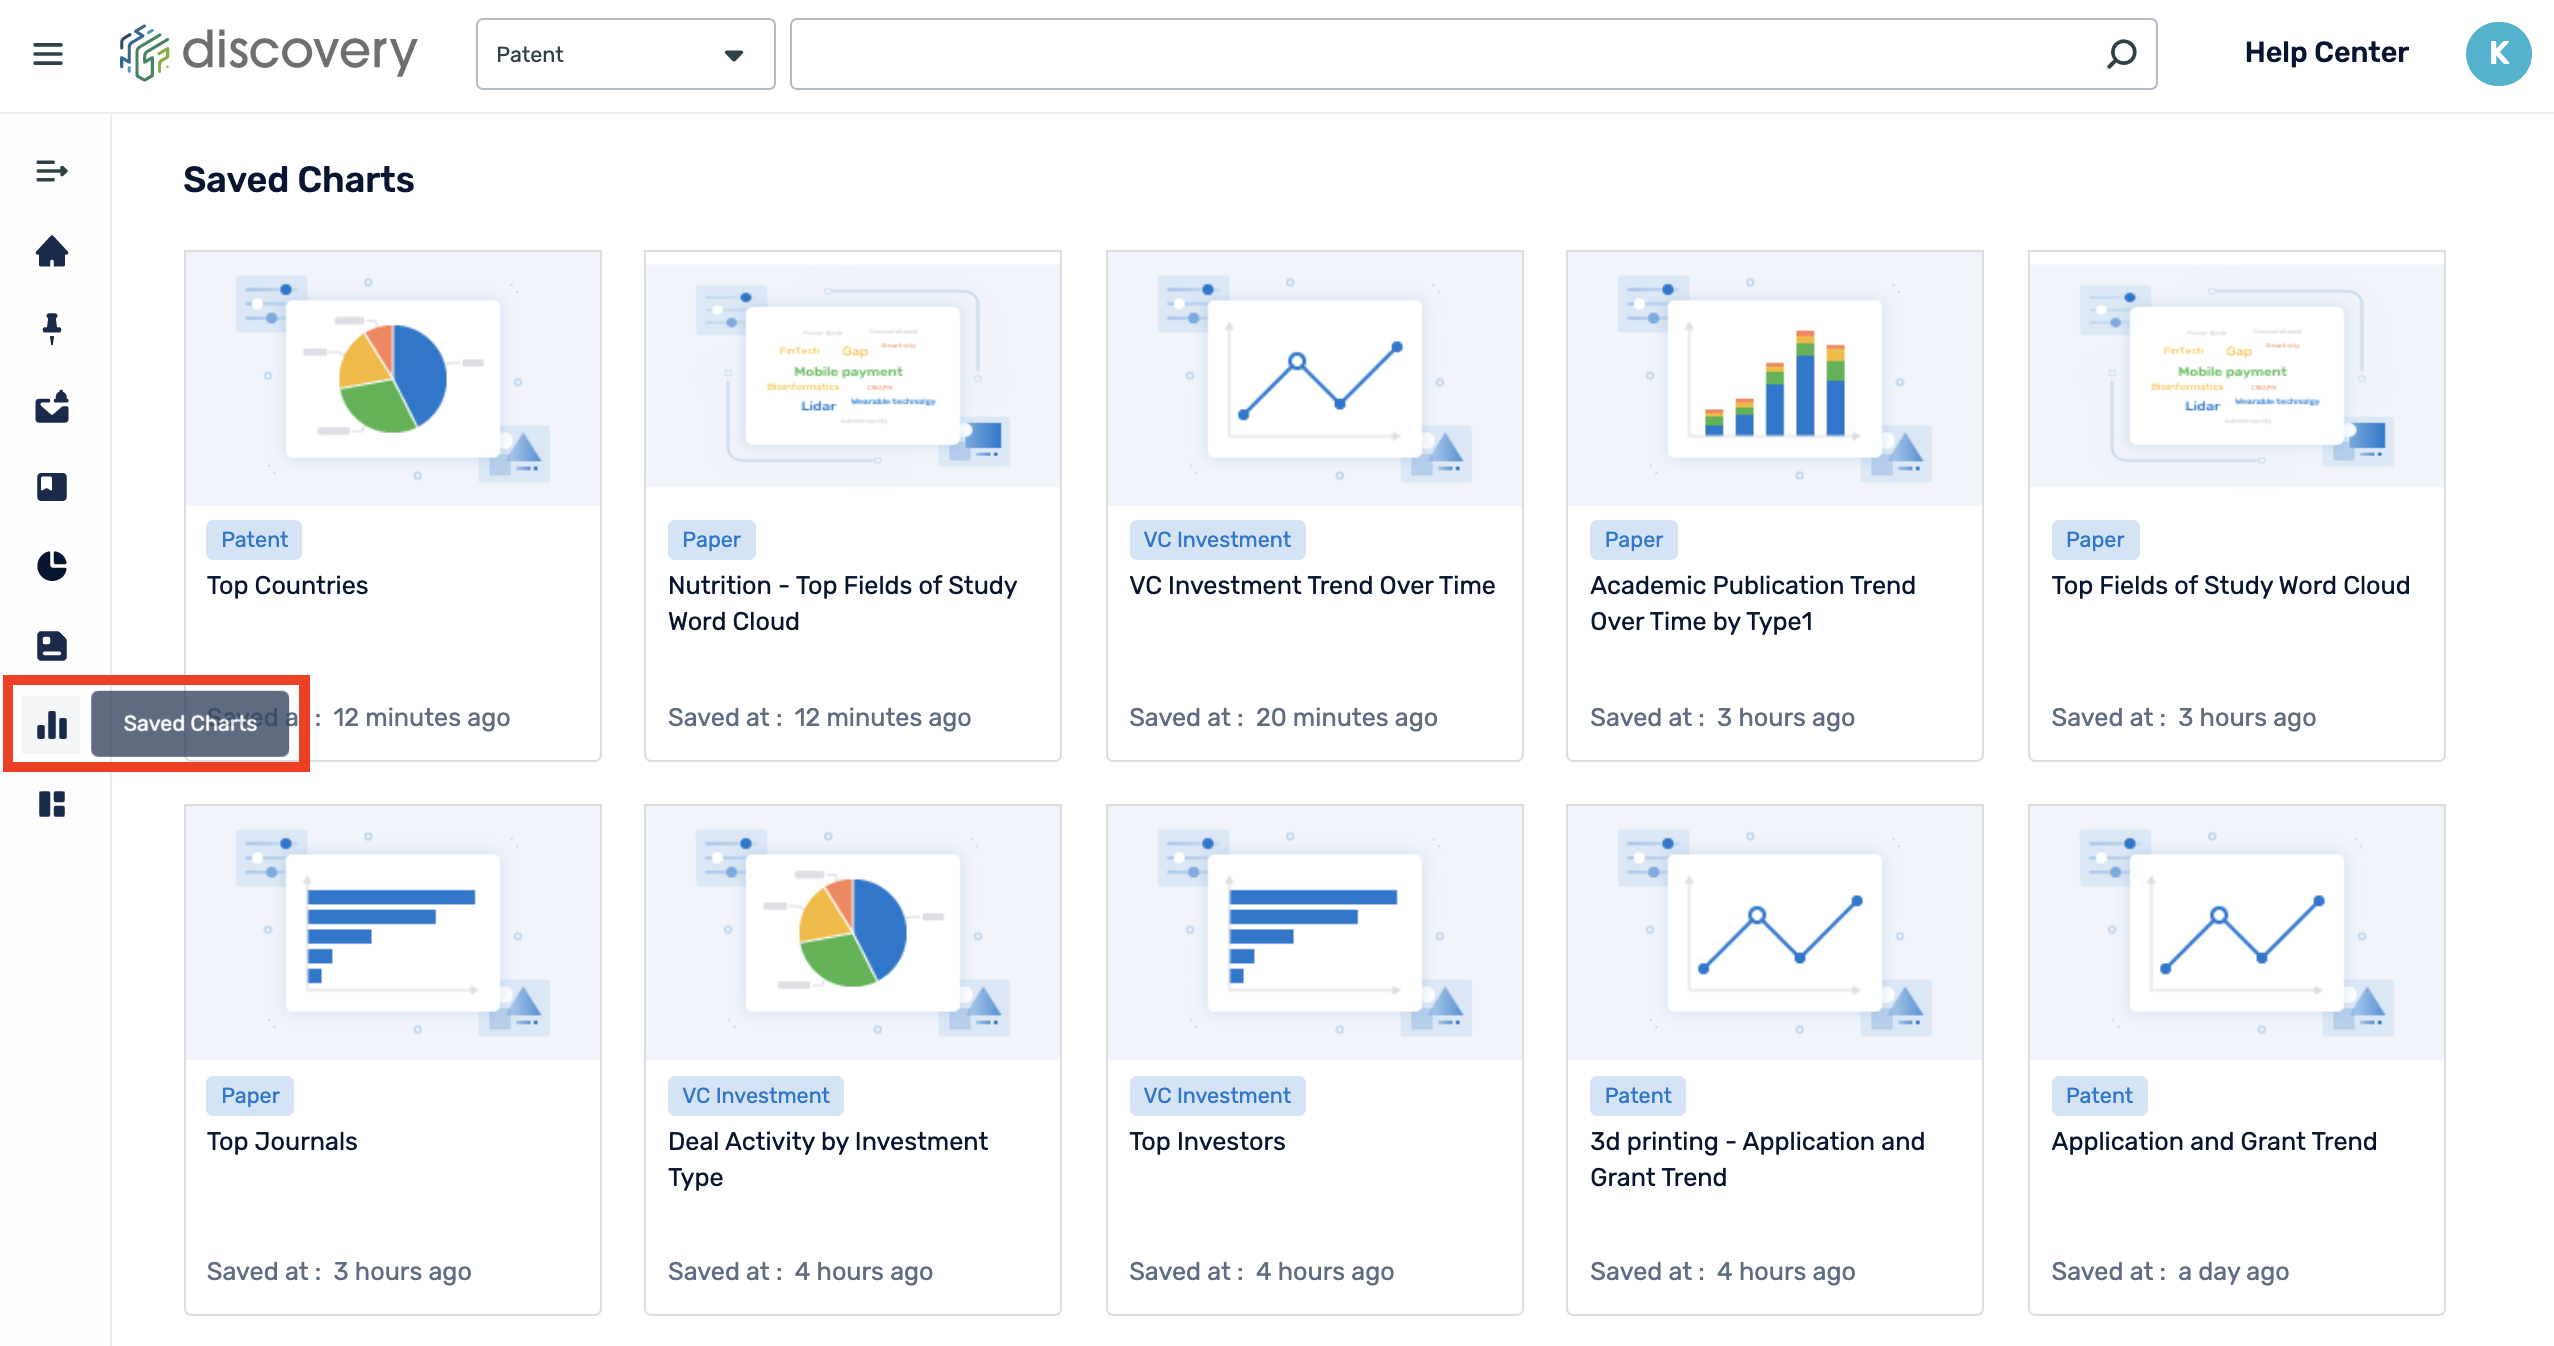
On the left-hand side menu, you can find all your saved charts in "Saved Charts". You can delete charts or edit the chart name.
Create custom insights dashboards
Save, comment on, and monitor your favorite data analysis charts by creating your own customized dashboards.
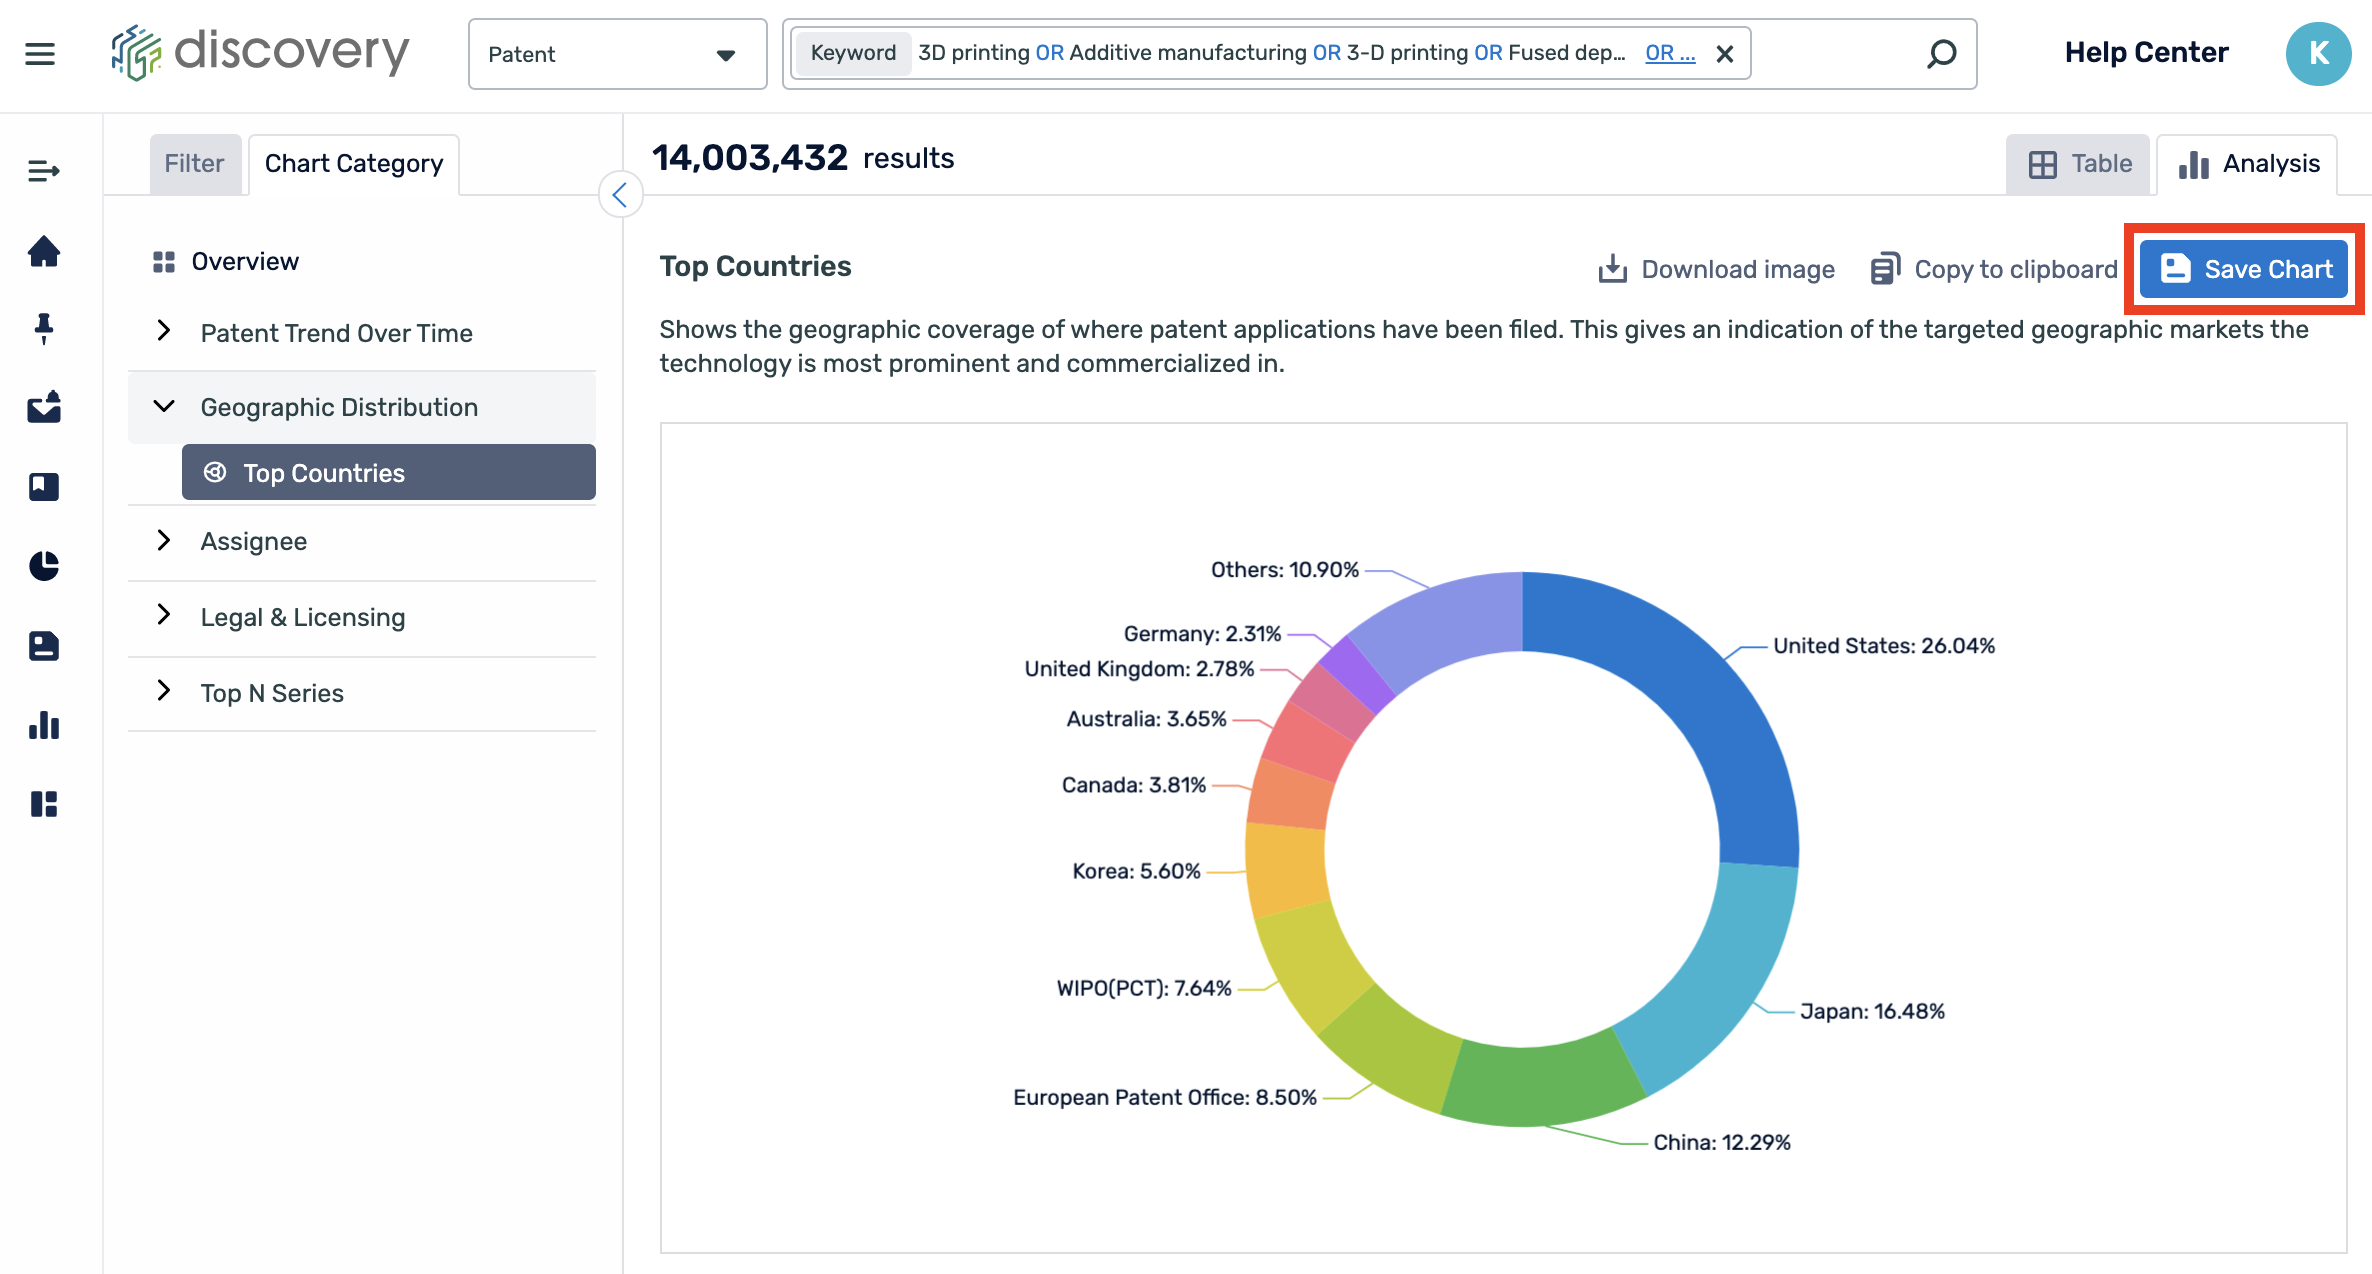
To add a chart to a dashboard, you must also simultaneously save the chart. To do this, once you have found a chart of interest, click “Save Chart”.
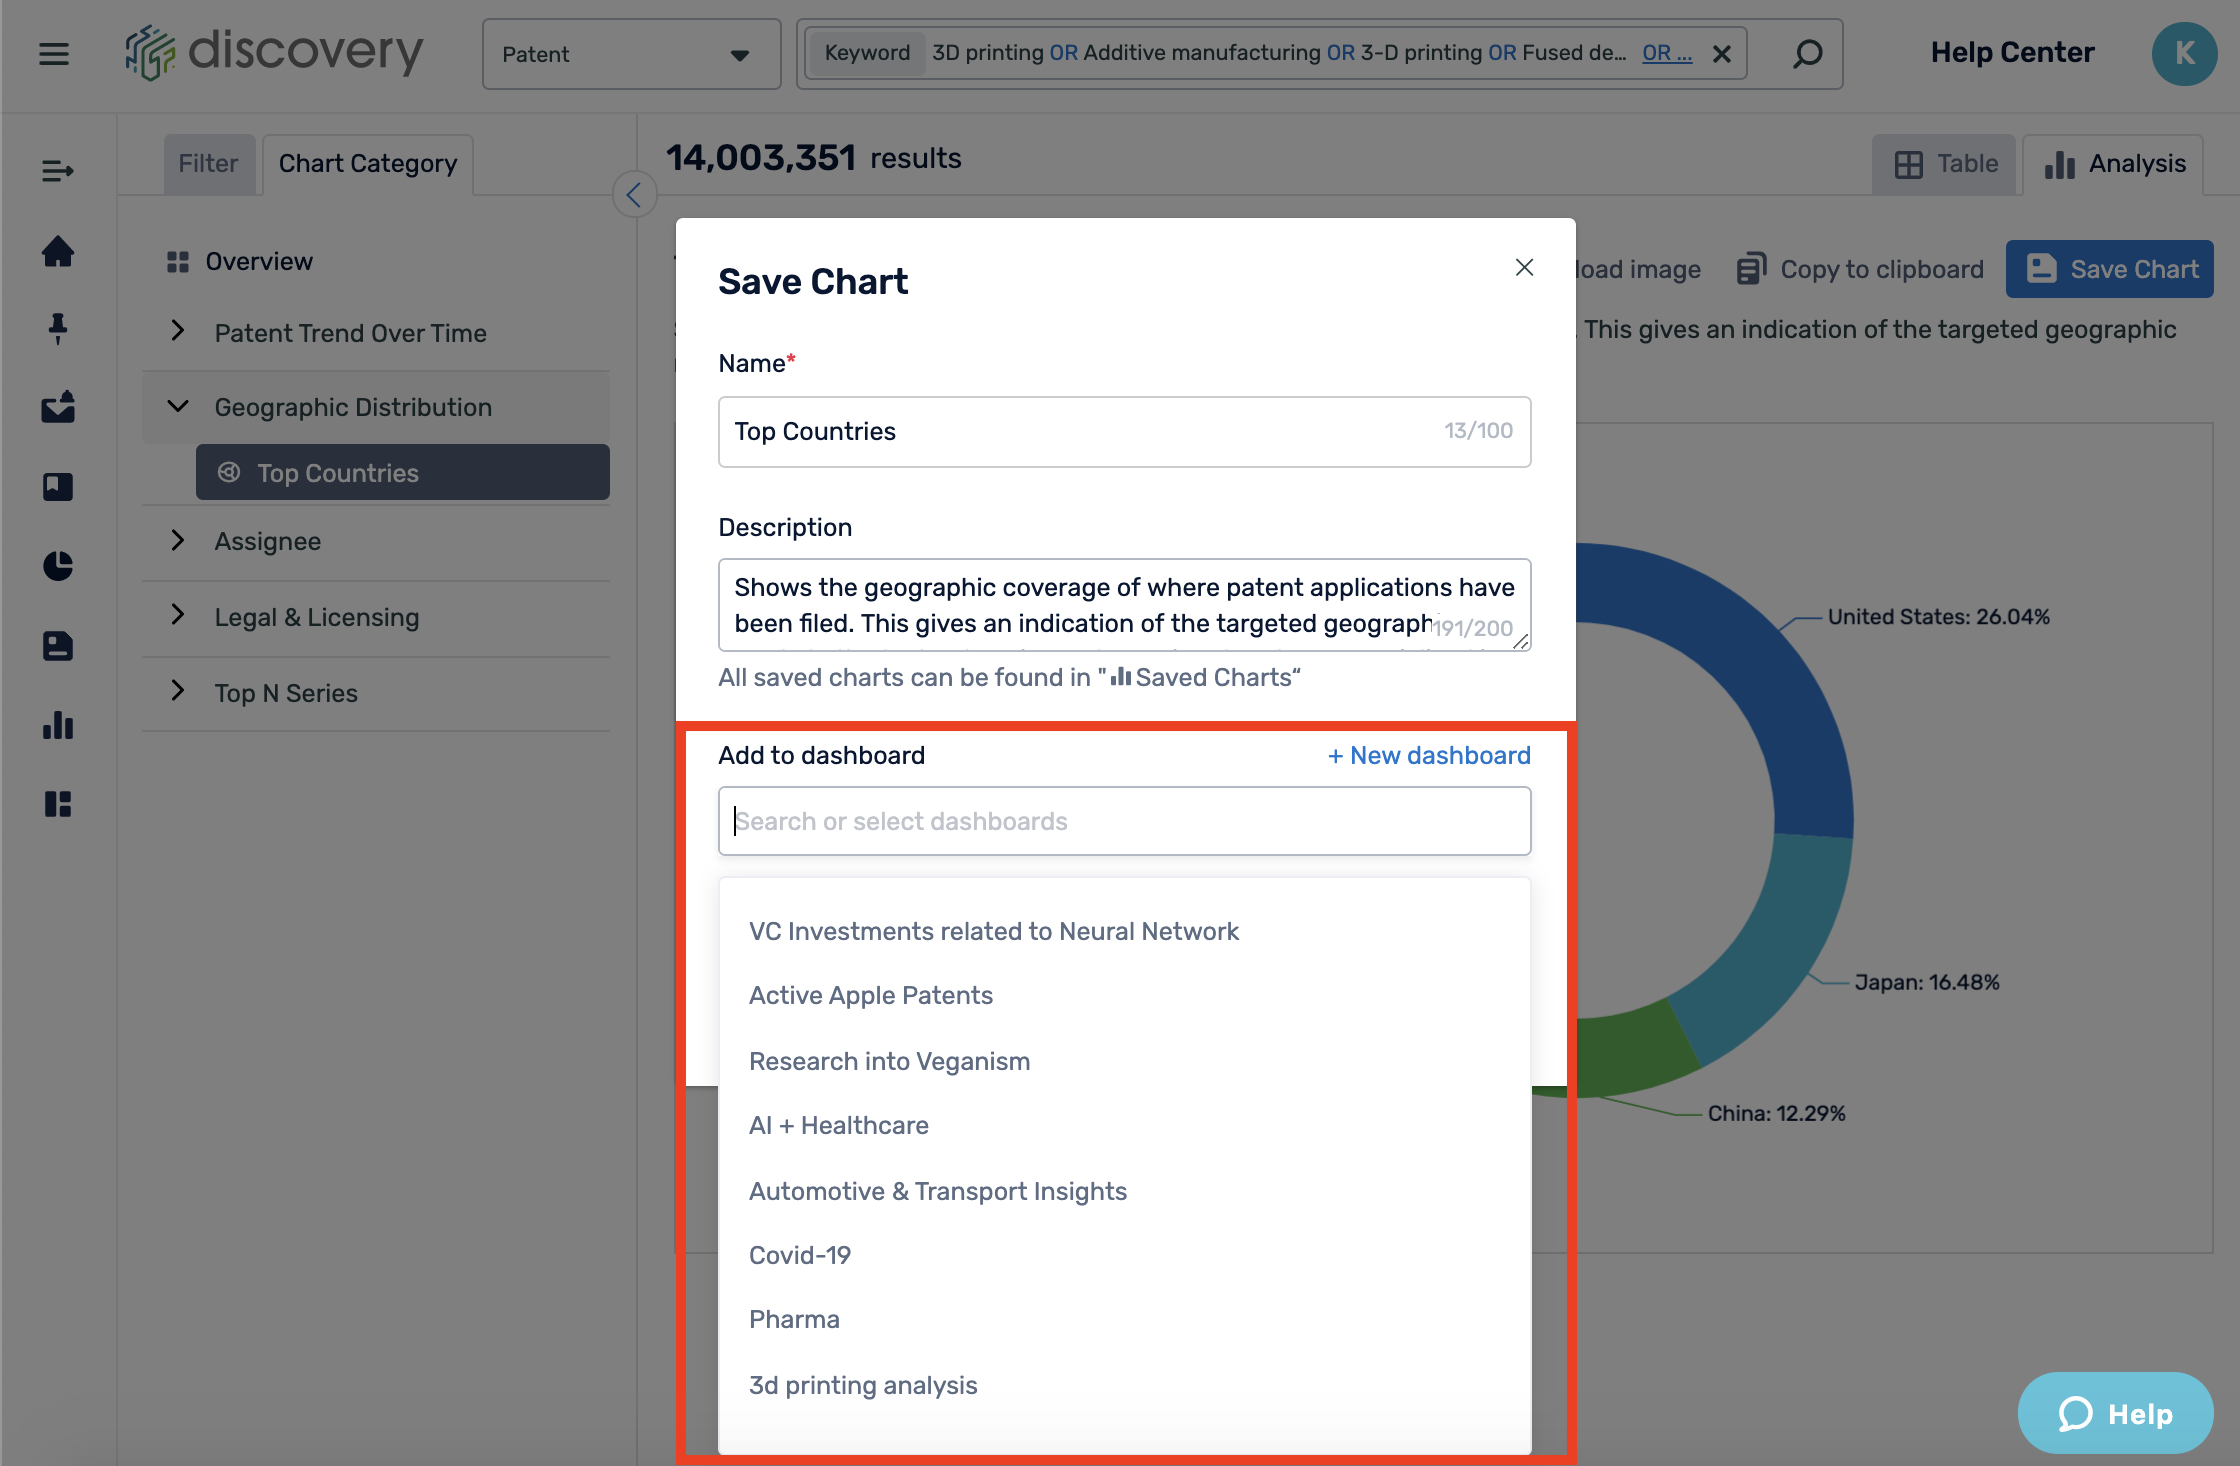
In the option to "Add to dashboard", you can select a dashboard from the ones that you have previously created or you can create a new dashboard.
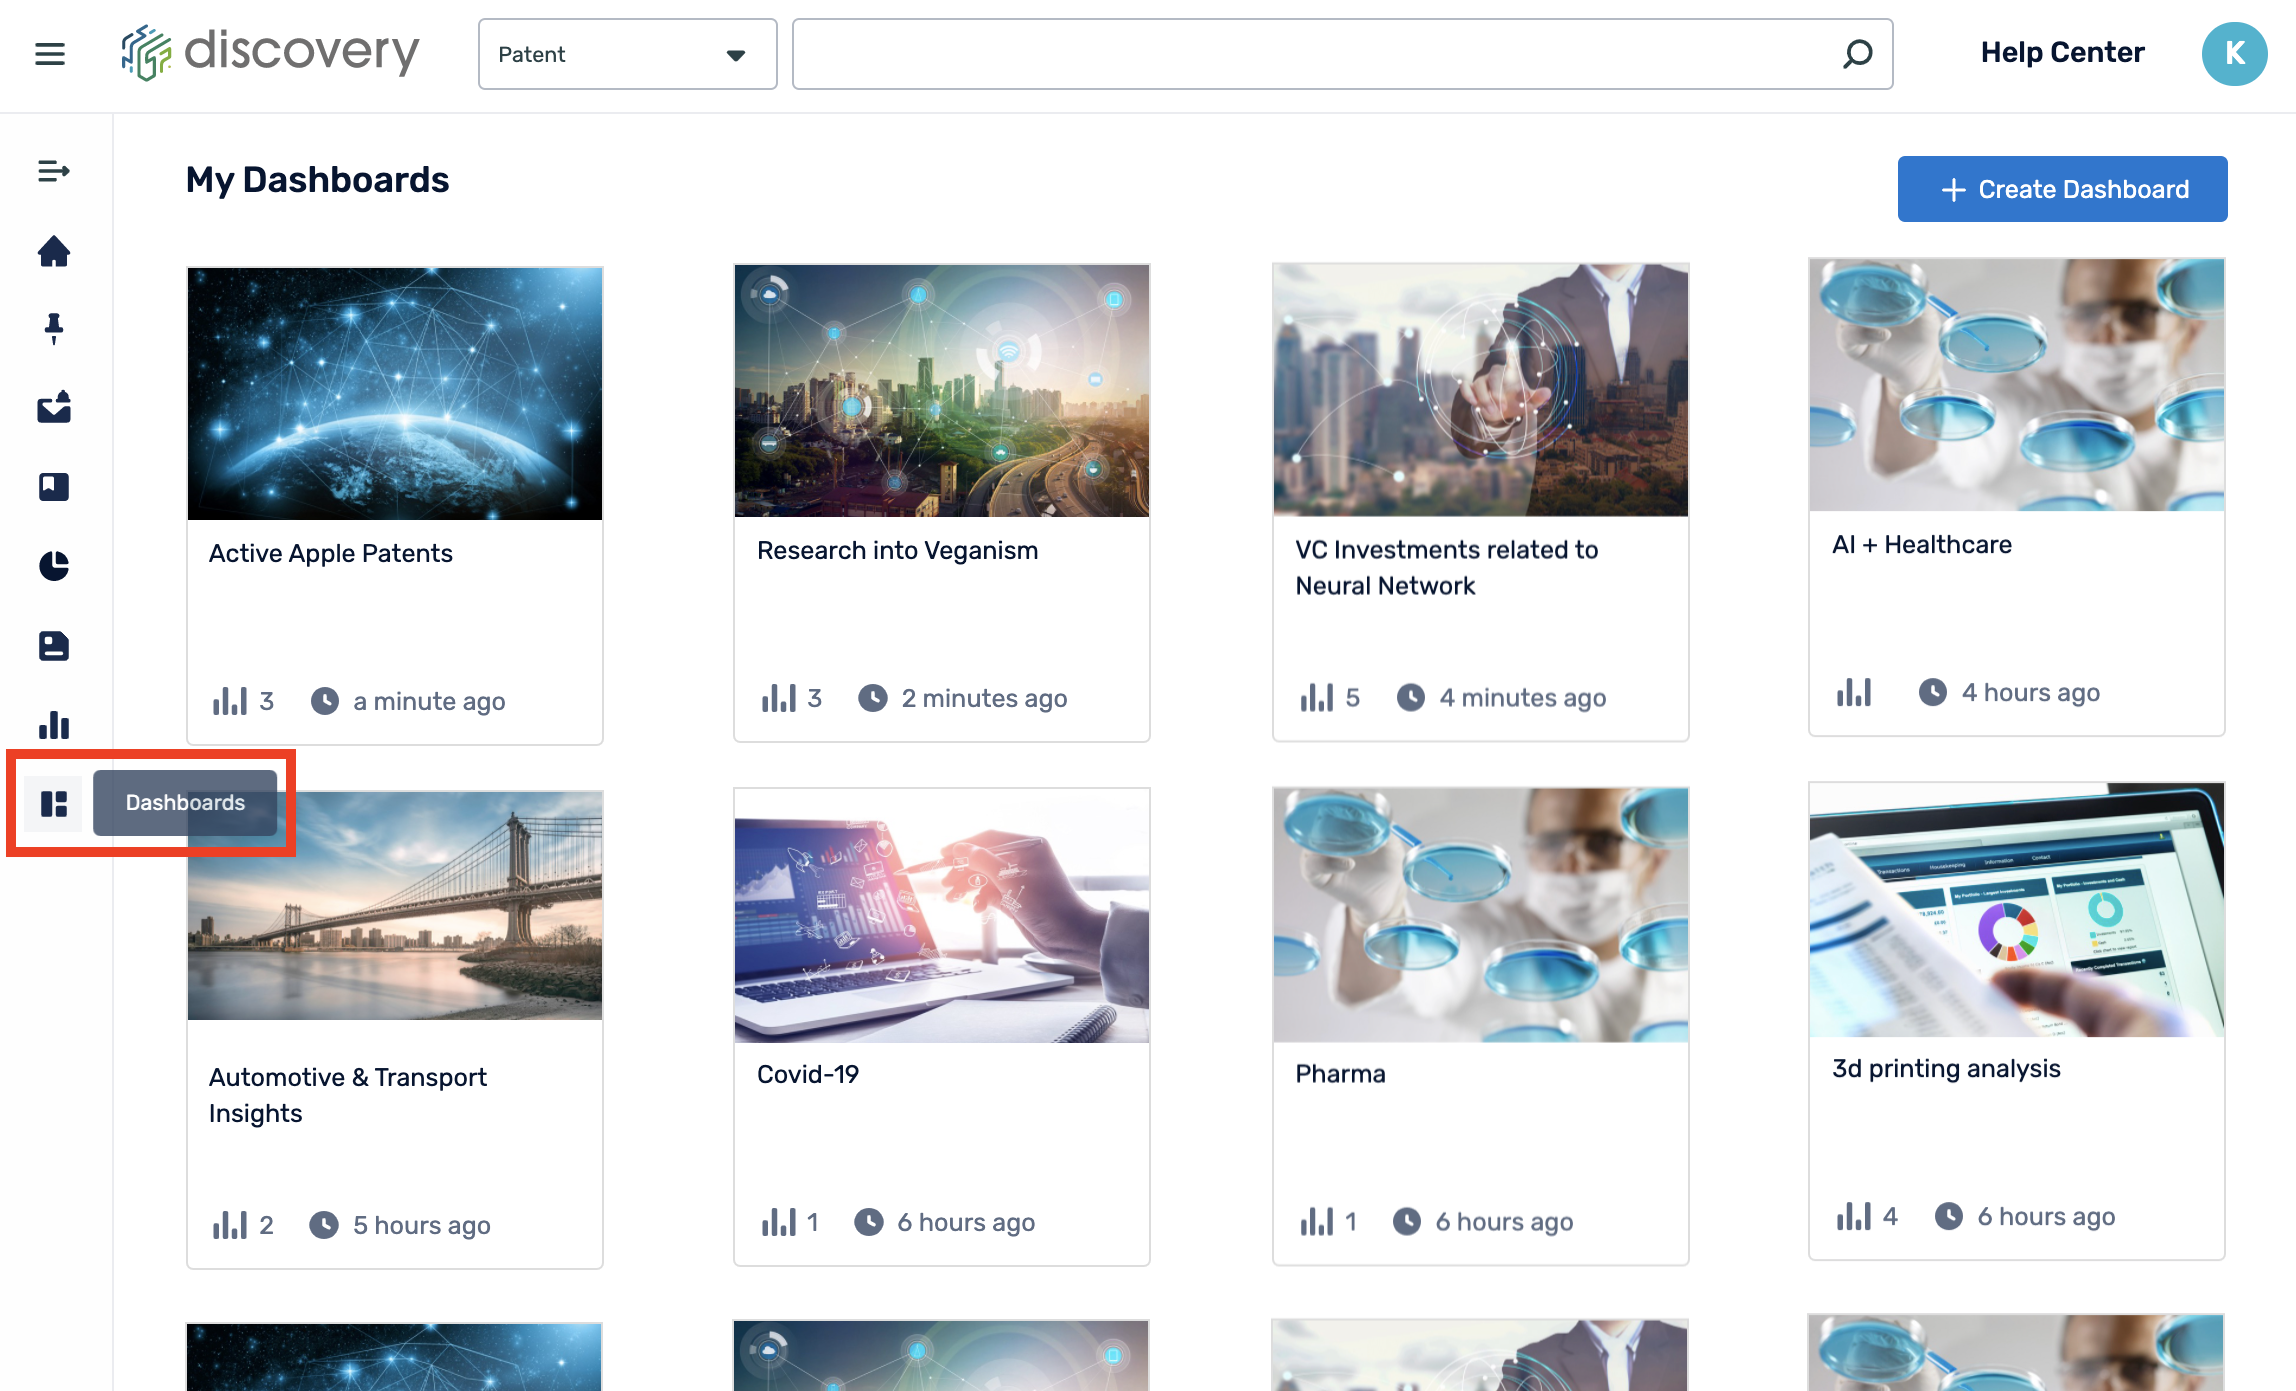
On the left-hand side menu, you can find all your created dashboards in "Dashboards". You can create a new dashboard, edit, delete, and view the contents of the dashboards.
Interactive charts
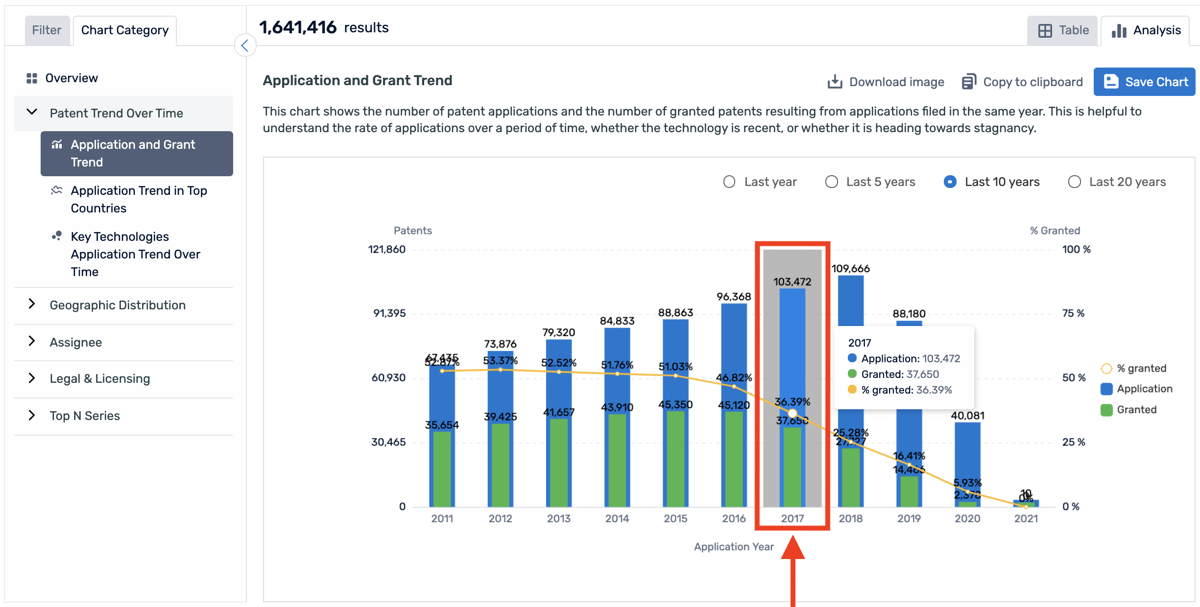
On the "Analysis" tab, once you have found a chart of interest, you can click on a segment of the chart to view raw data.
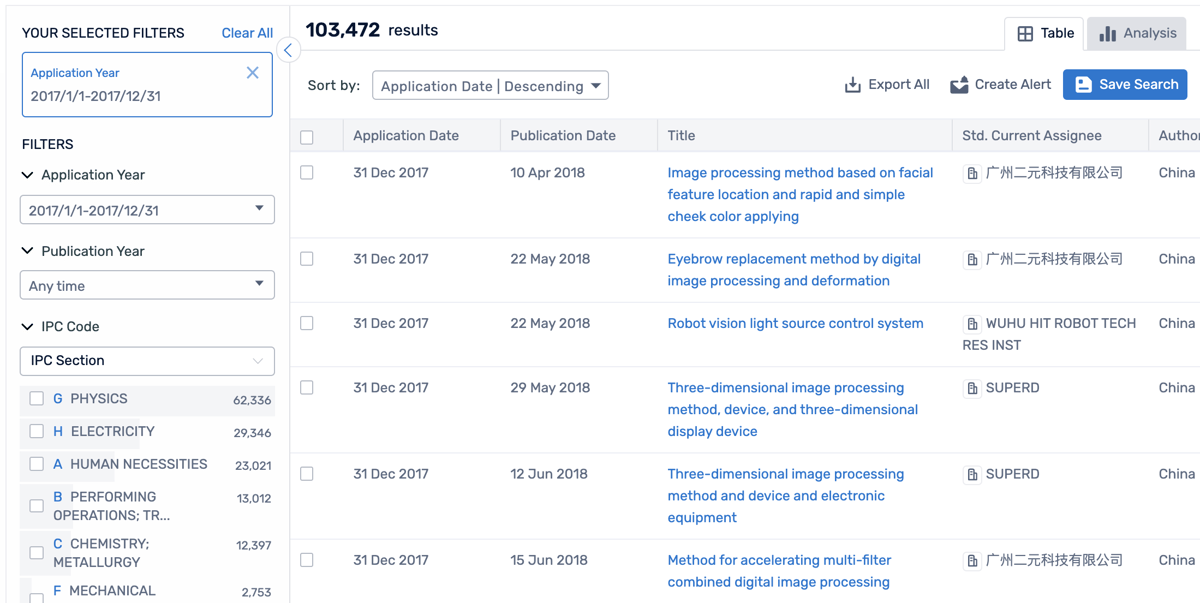
You will be taken to a results page with the corresponding results.
Comments
0 comments
Please sign in to leave a comment.