


You can now save any analysis chart from the "Analysis" tab in Discovery. Keep track of all your favorite charts in one place.
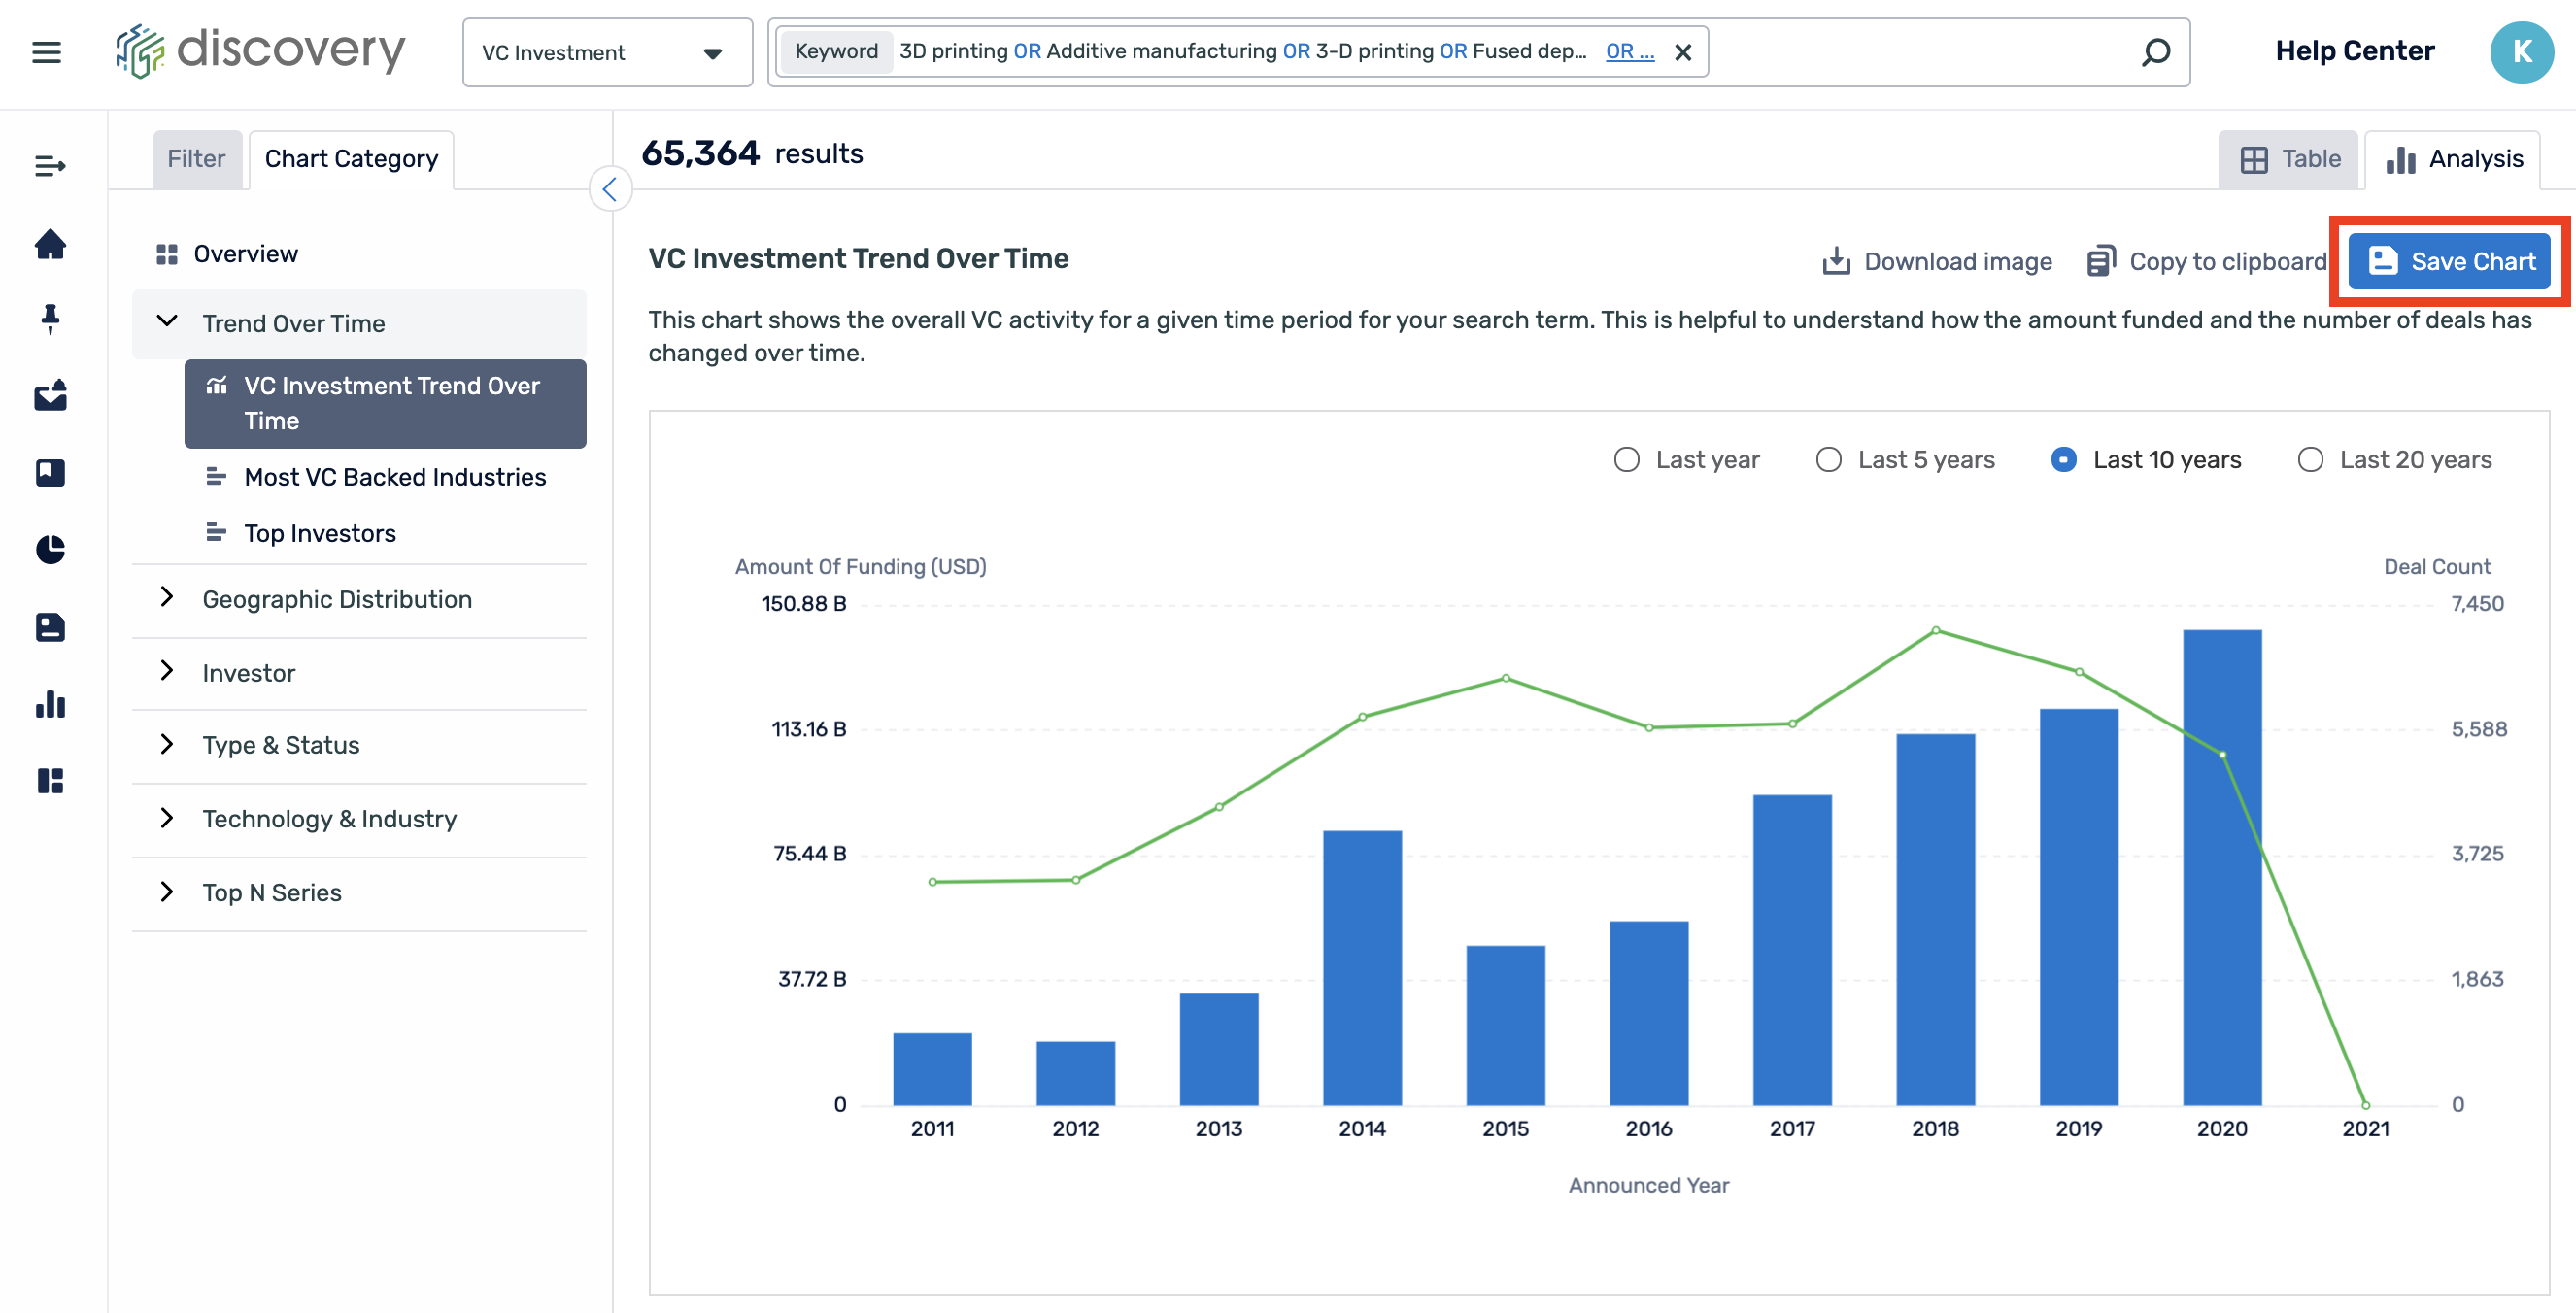
You can find this function once you have performed a search based on a specific data type, click on the "Analysis" tab to find all related charts.
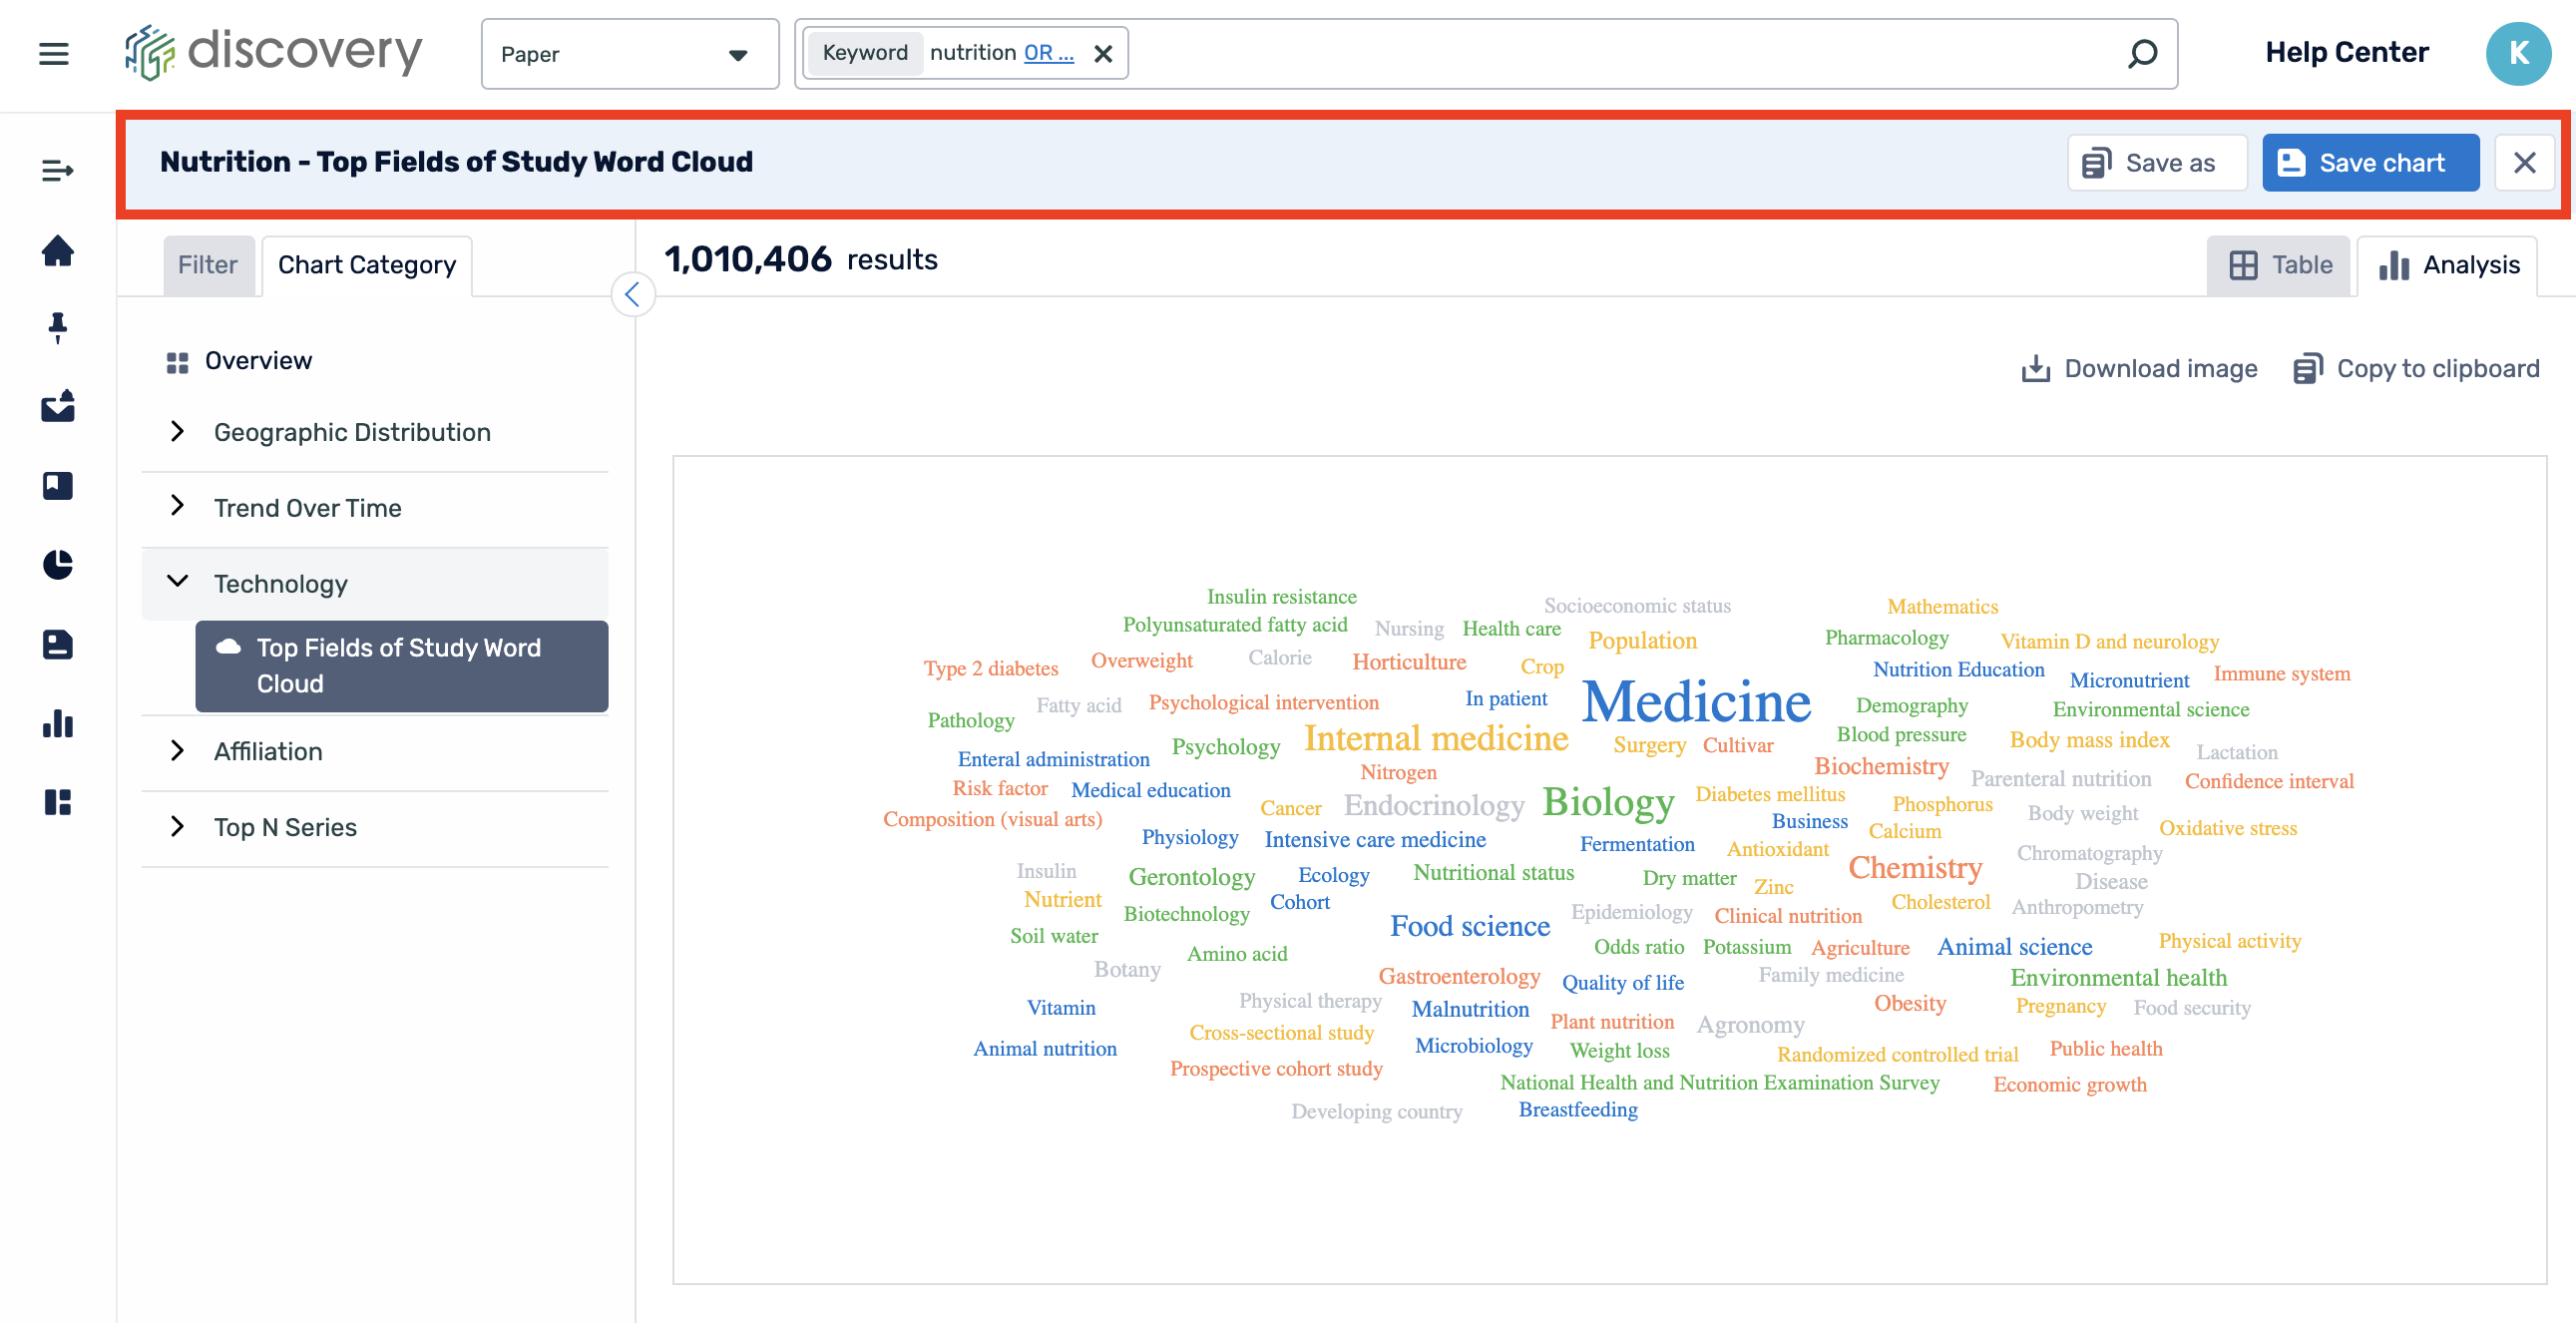
Once you have found a chart of interest, you can click "Save Chart". Any refinement filters selected will be saved as well as the time range that is selected.
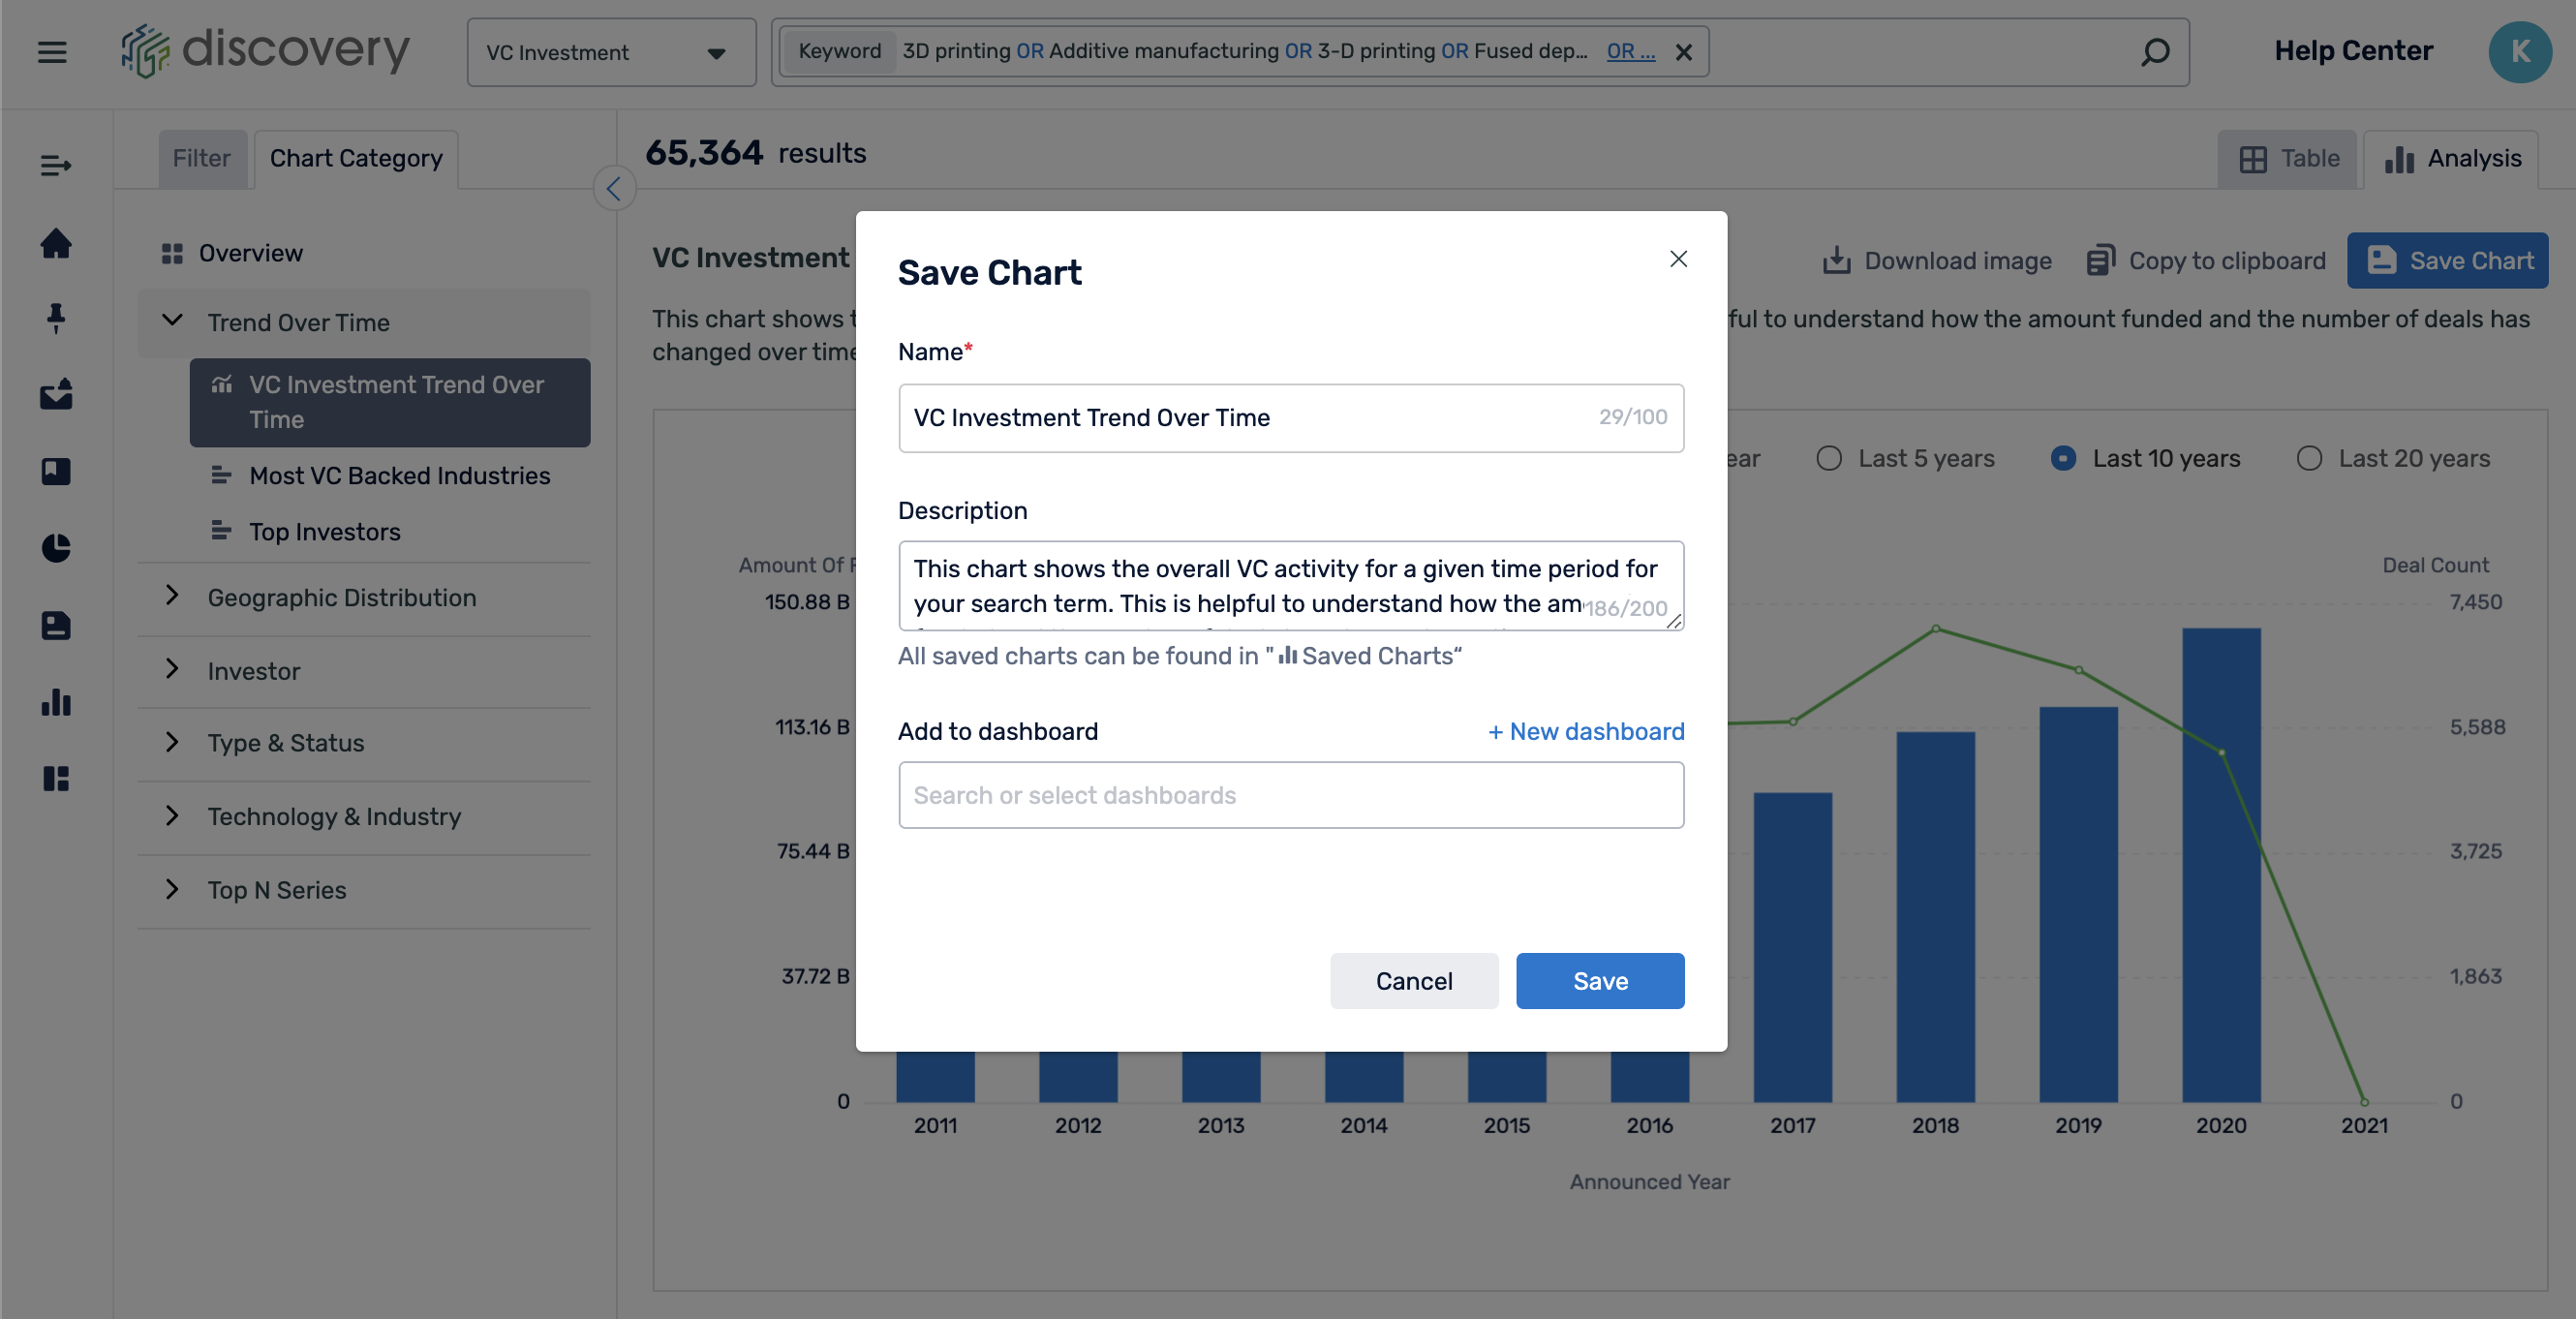
Here you can change the name and description of the chart, you can also create customized dashboards, and add your charts there.
It is recommended that you change the chart name by adding a unique identifier such as the technology area or keyword you used within your search, this is so that you can easily find the charts you are looking for when returning back to it later.
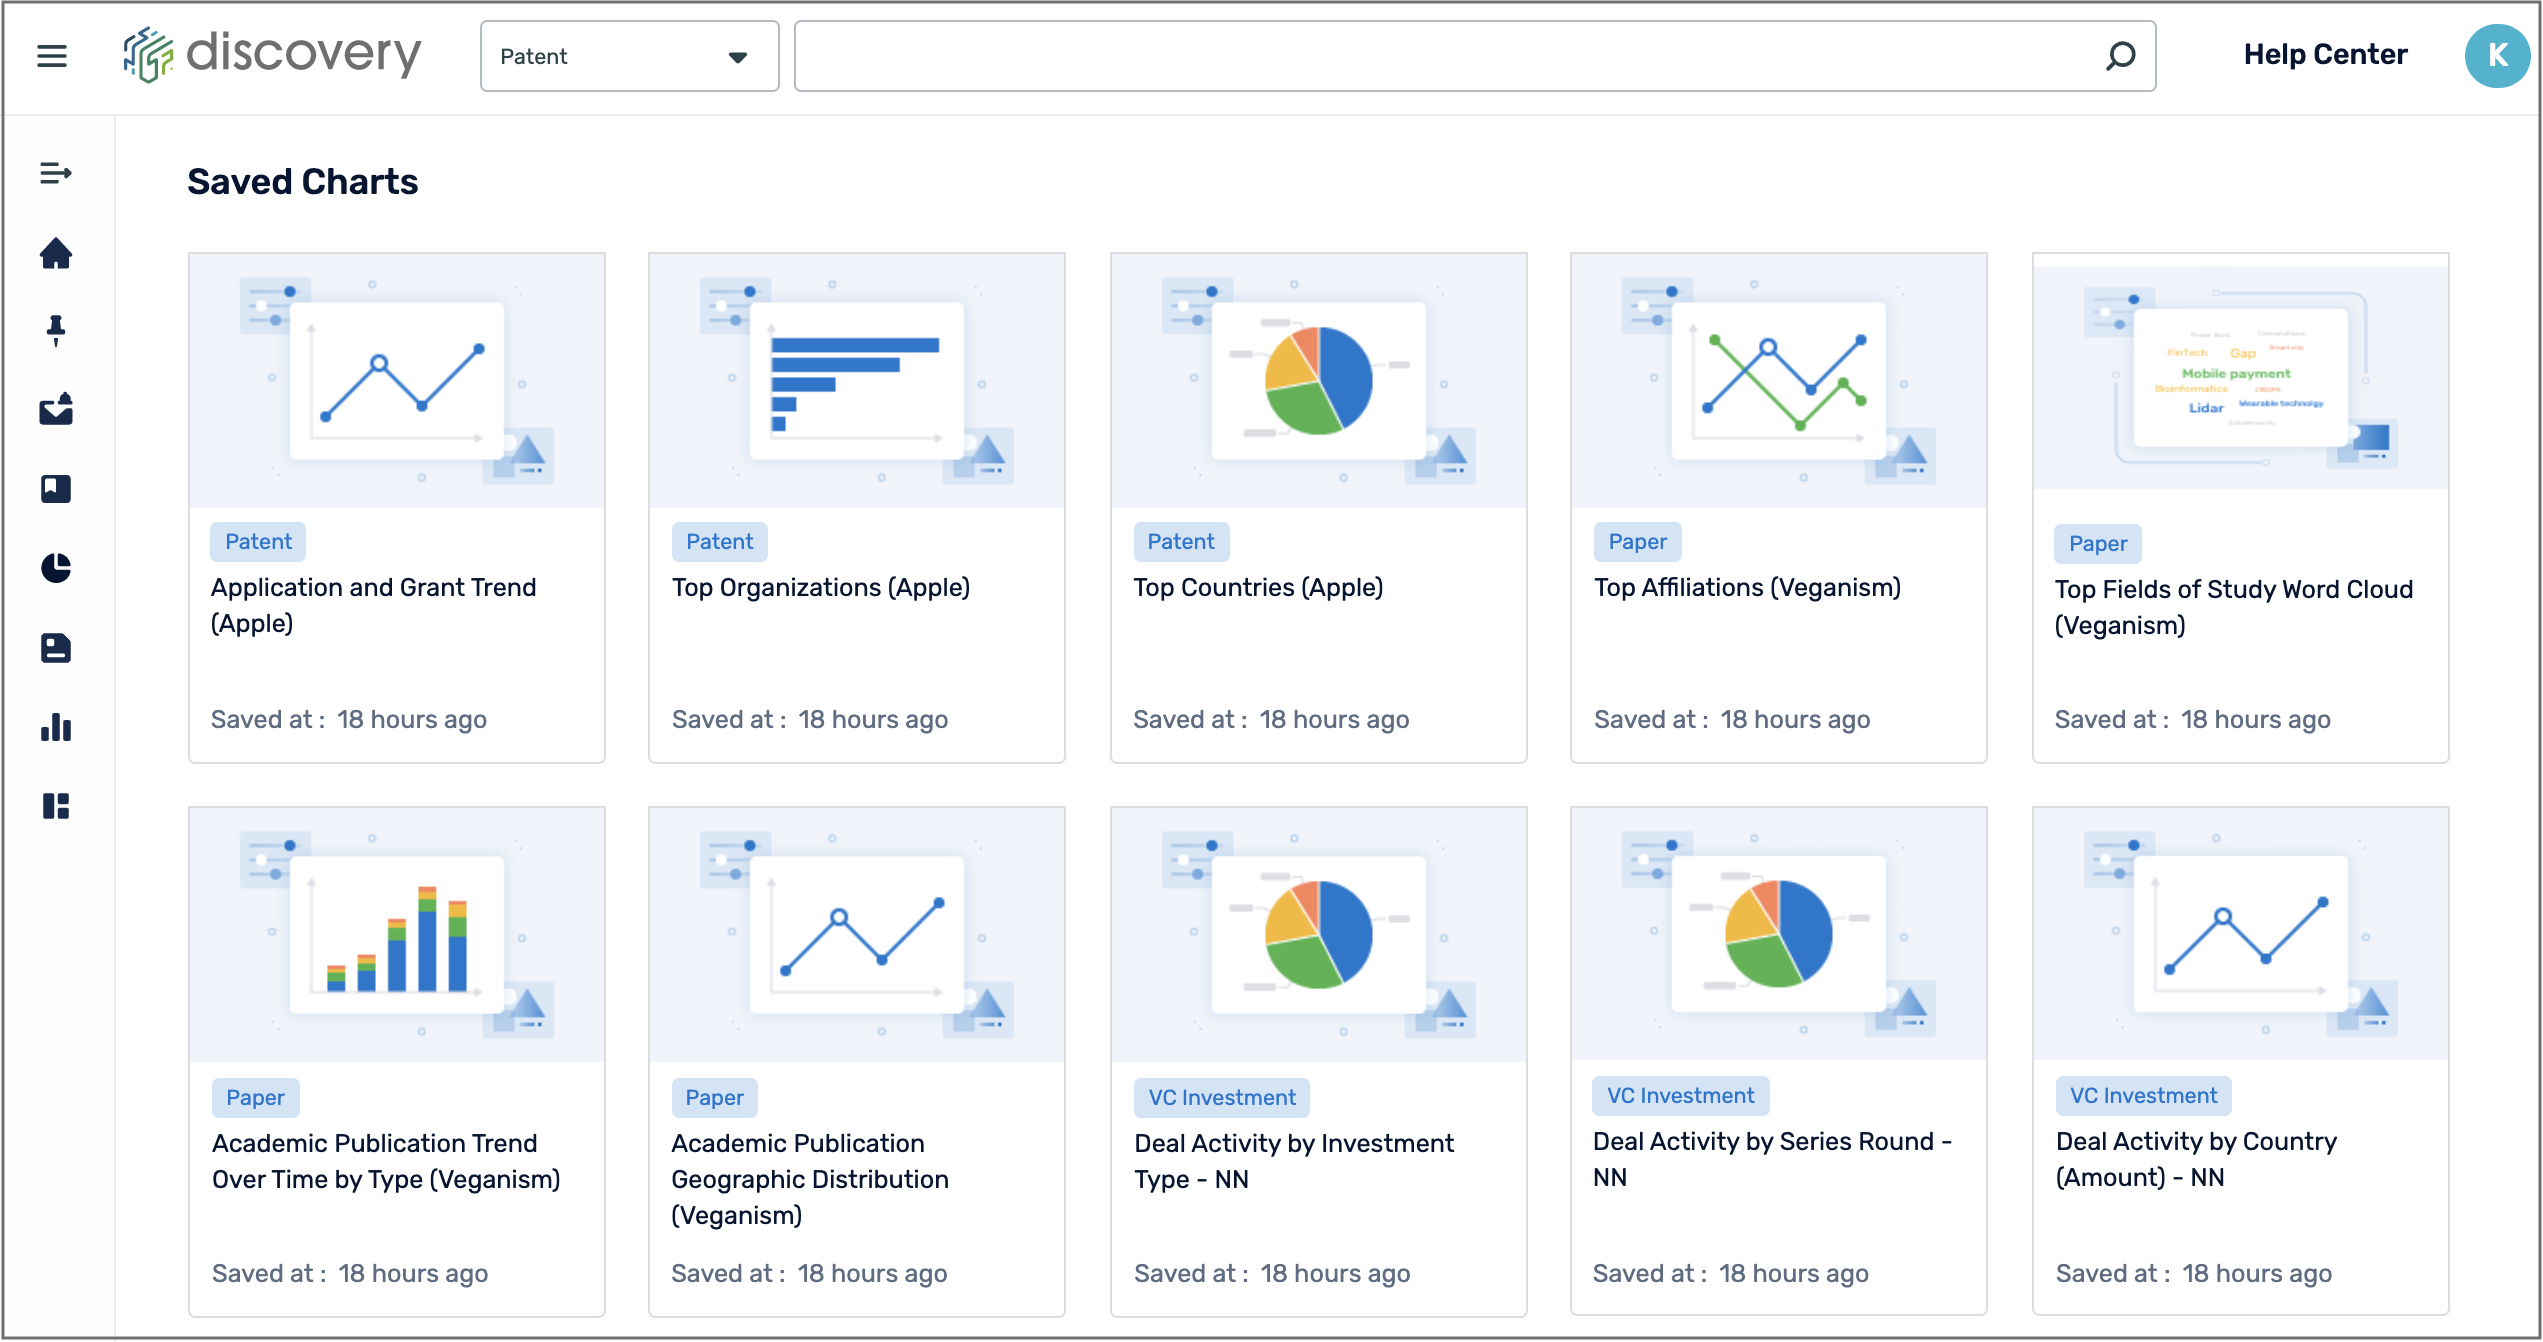
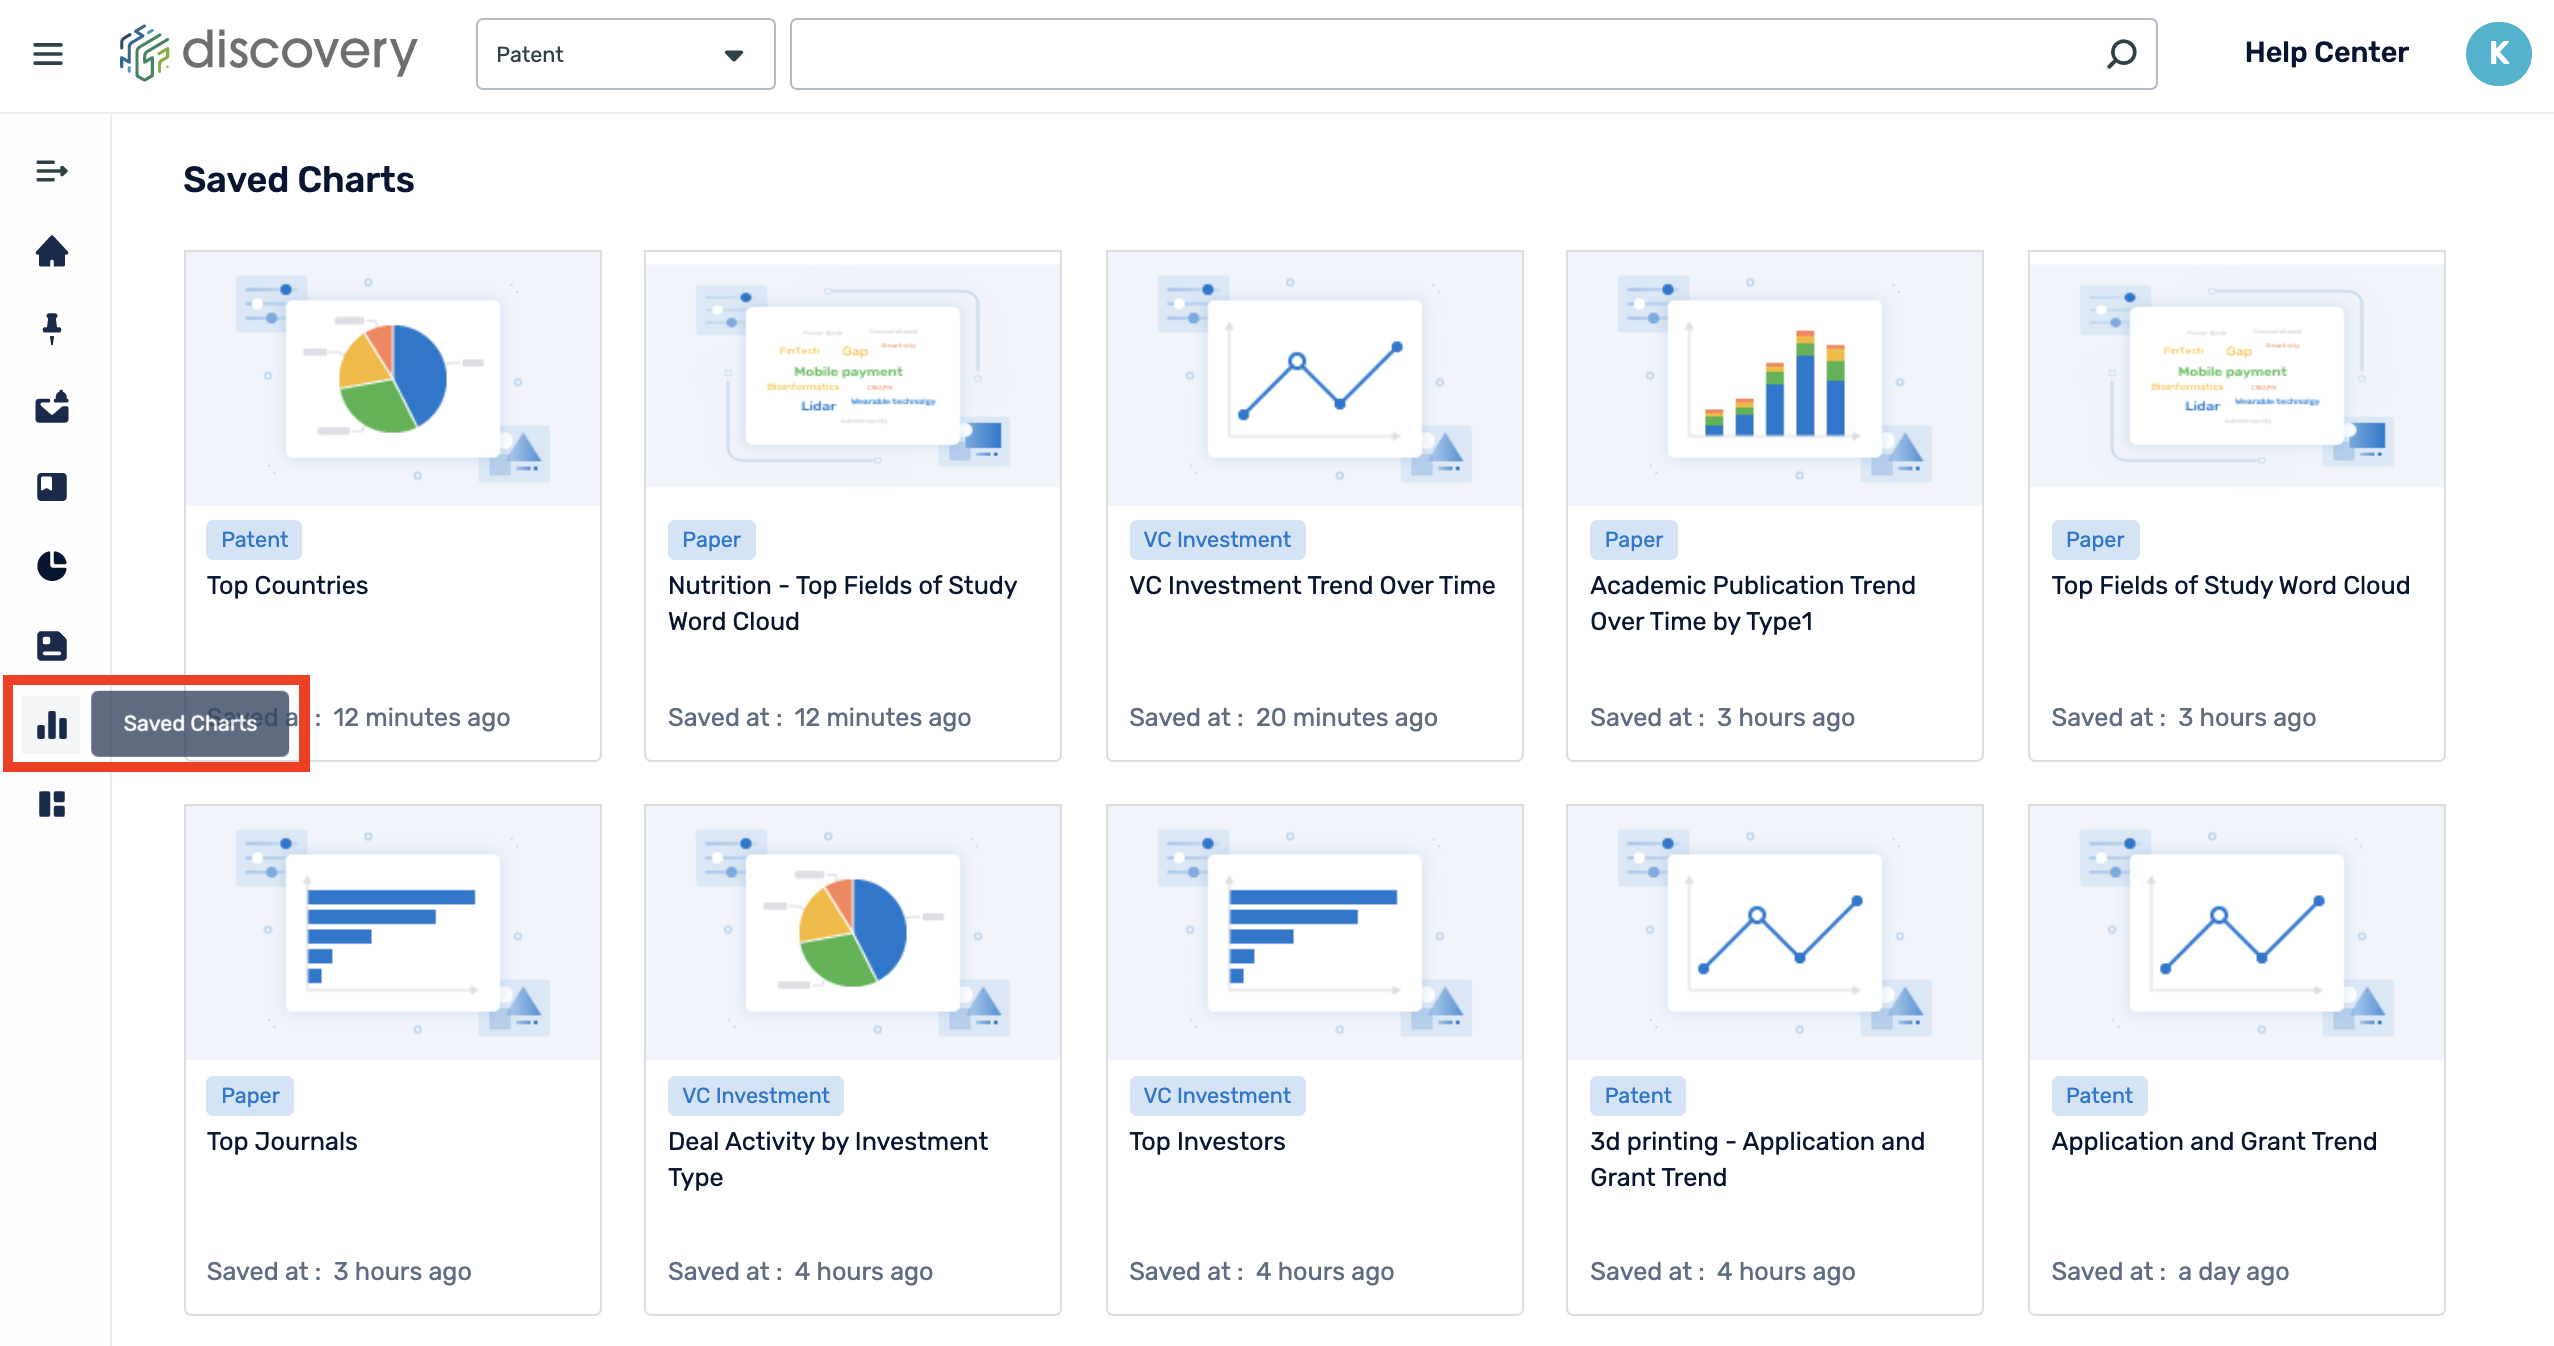
On the left-hand side menu, you can find all your saved charts in "Saved Charts". You can delete charts or edit the chart name.
Clicking on a chart from the saved charts page will bring you to his page where you can edit the name on the left side and click "Save Chart" to overwrite. You can also click "Save As" to save another copy of this chart.

Comments
0 comments
Please sign in to leave a comment.