


Save, comment on, and monitor your favorite data analysis charts by creating your own customized dashboards.
How to create dashboards
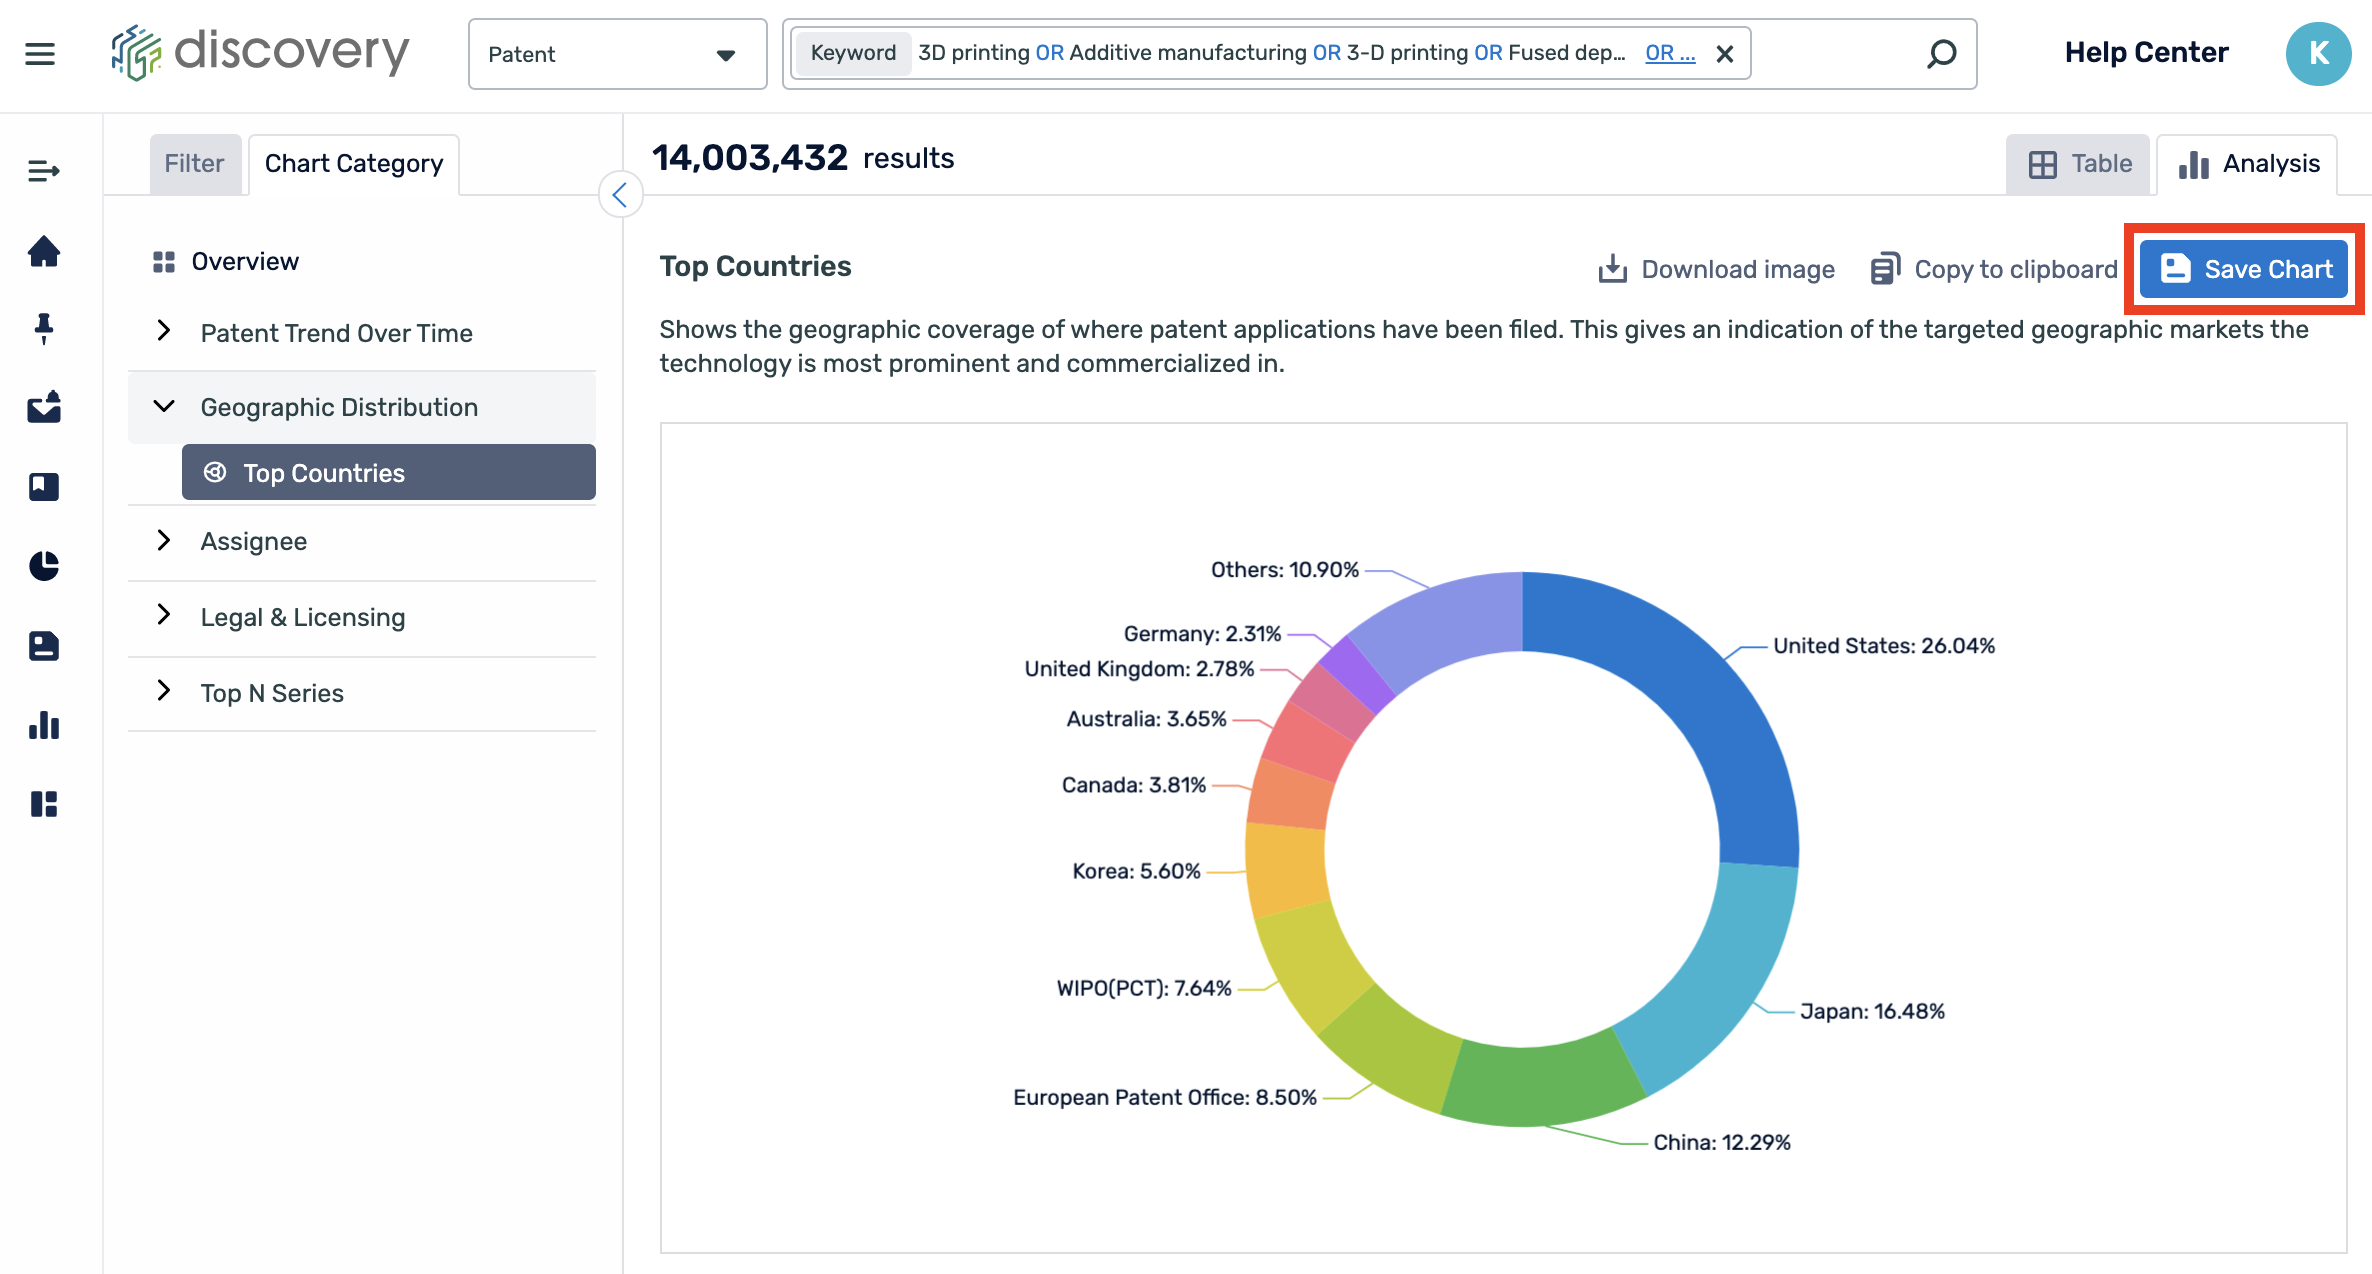
To add a chart to a dashboard, you must also simultaneously save the chart. To do this, once you have found a chart of interest, click “Save Chart”.
In the option to "Add to dashboard", you can select a dashboard from the ones that you have previously created or you can create a new dashboard.
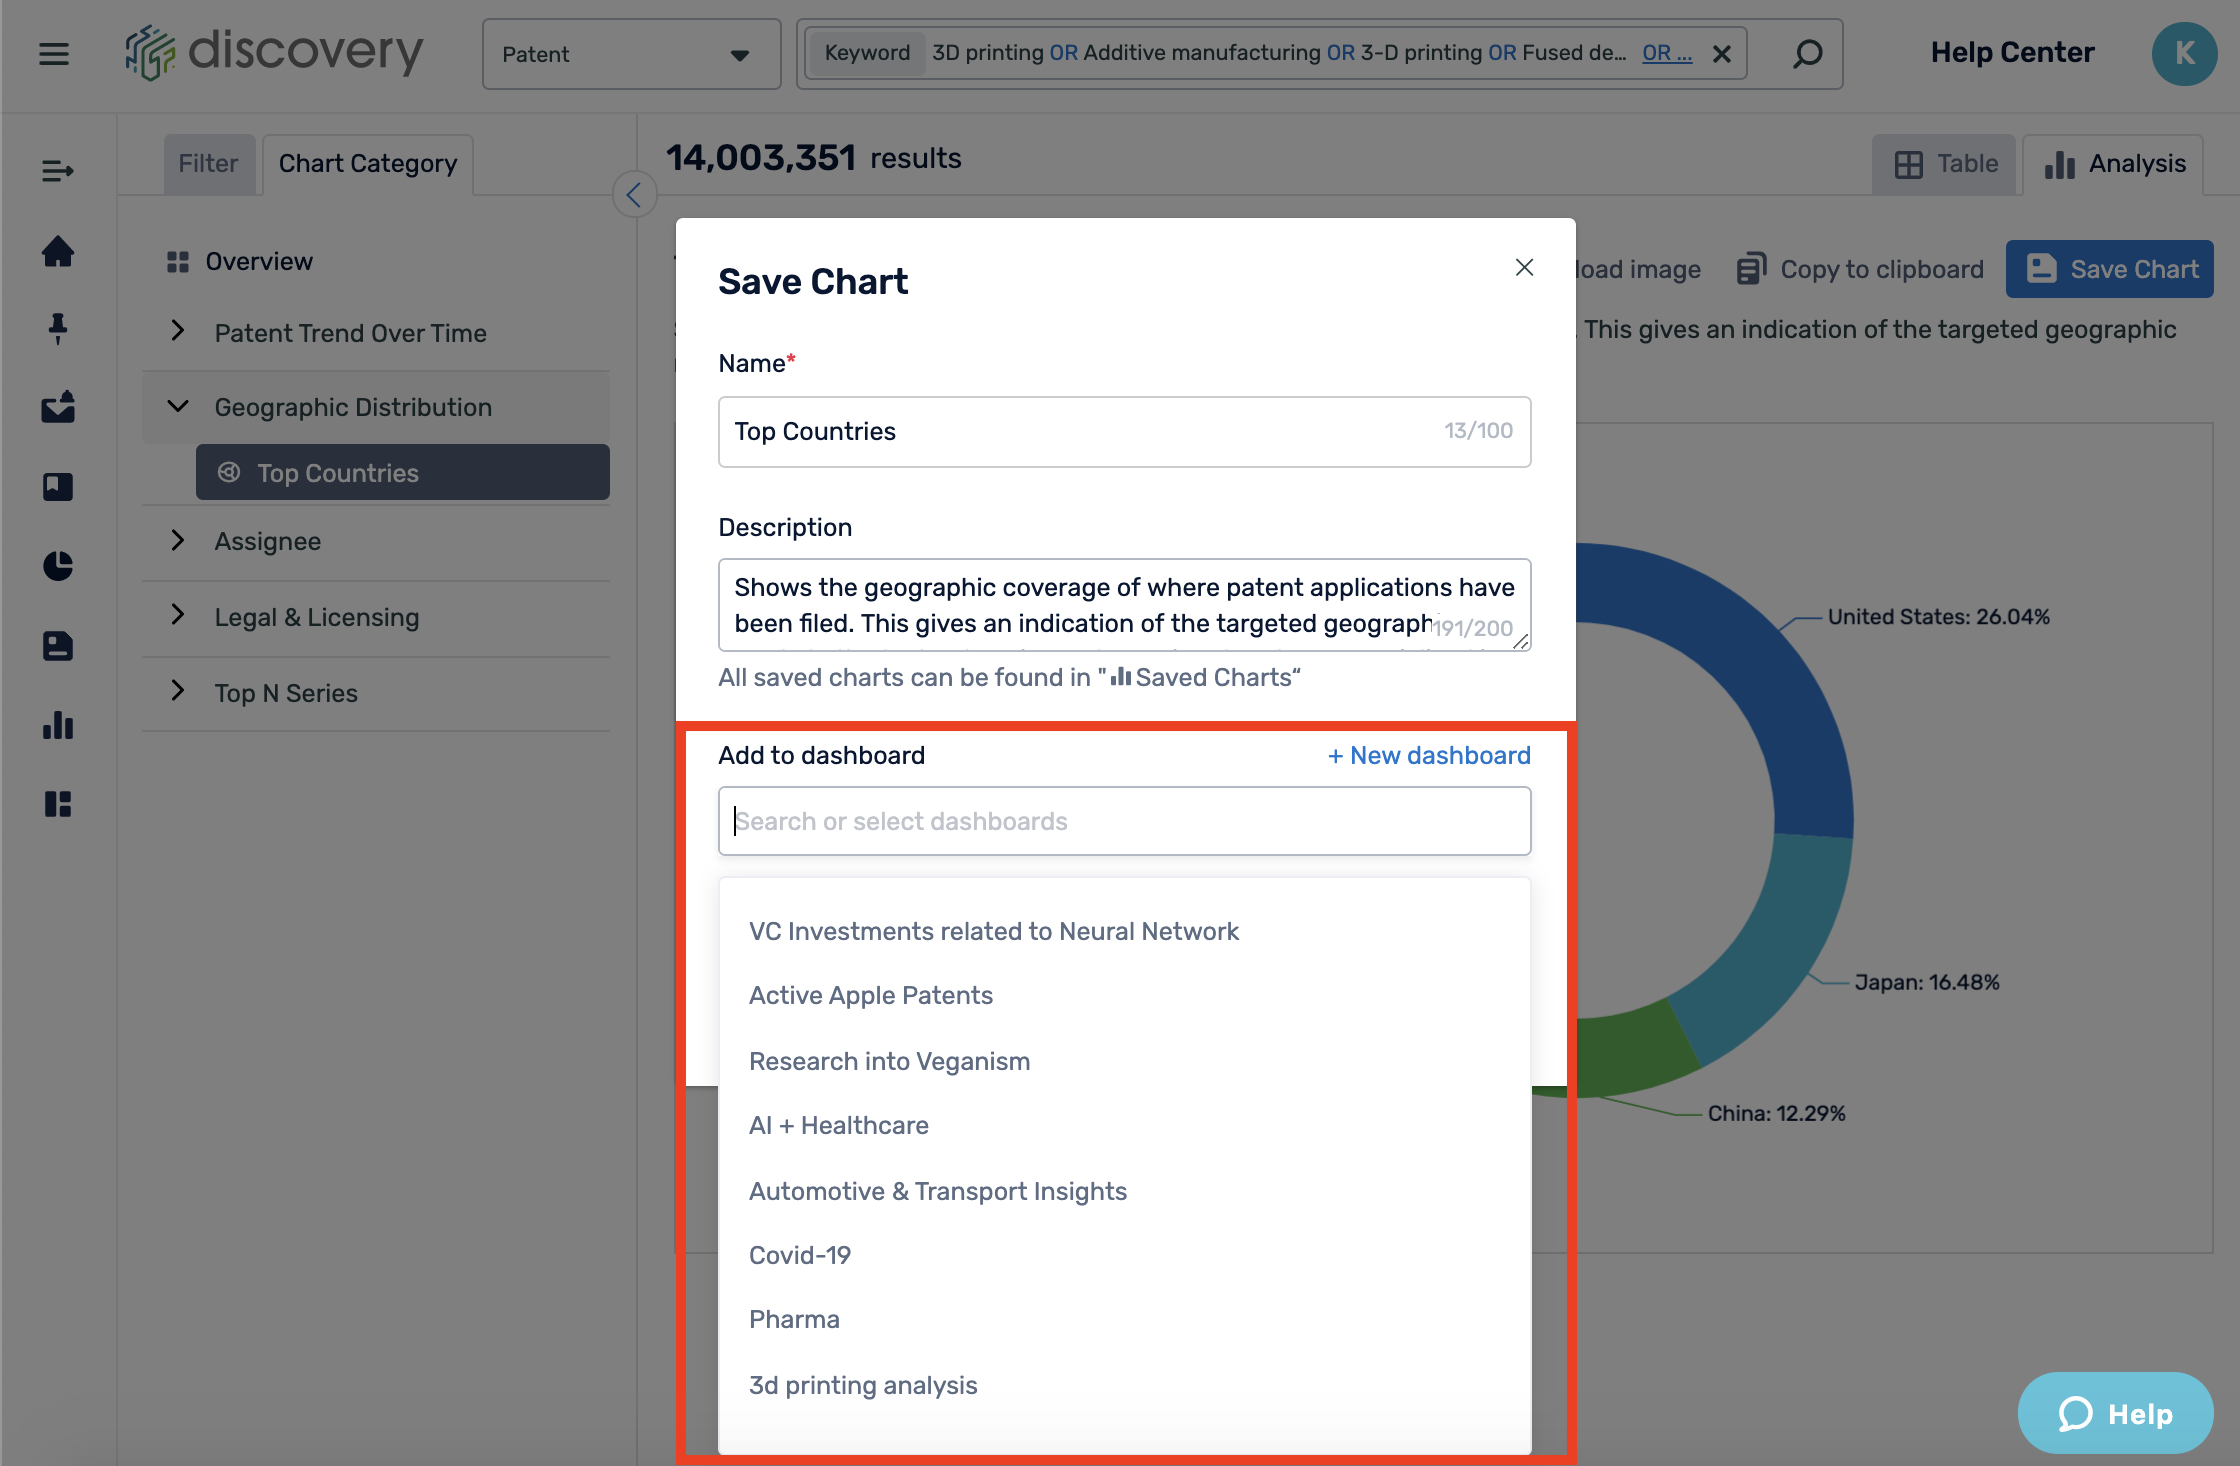
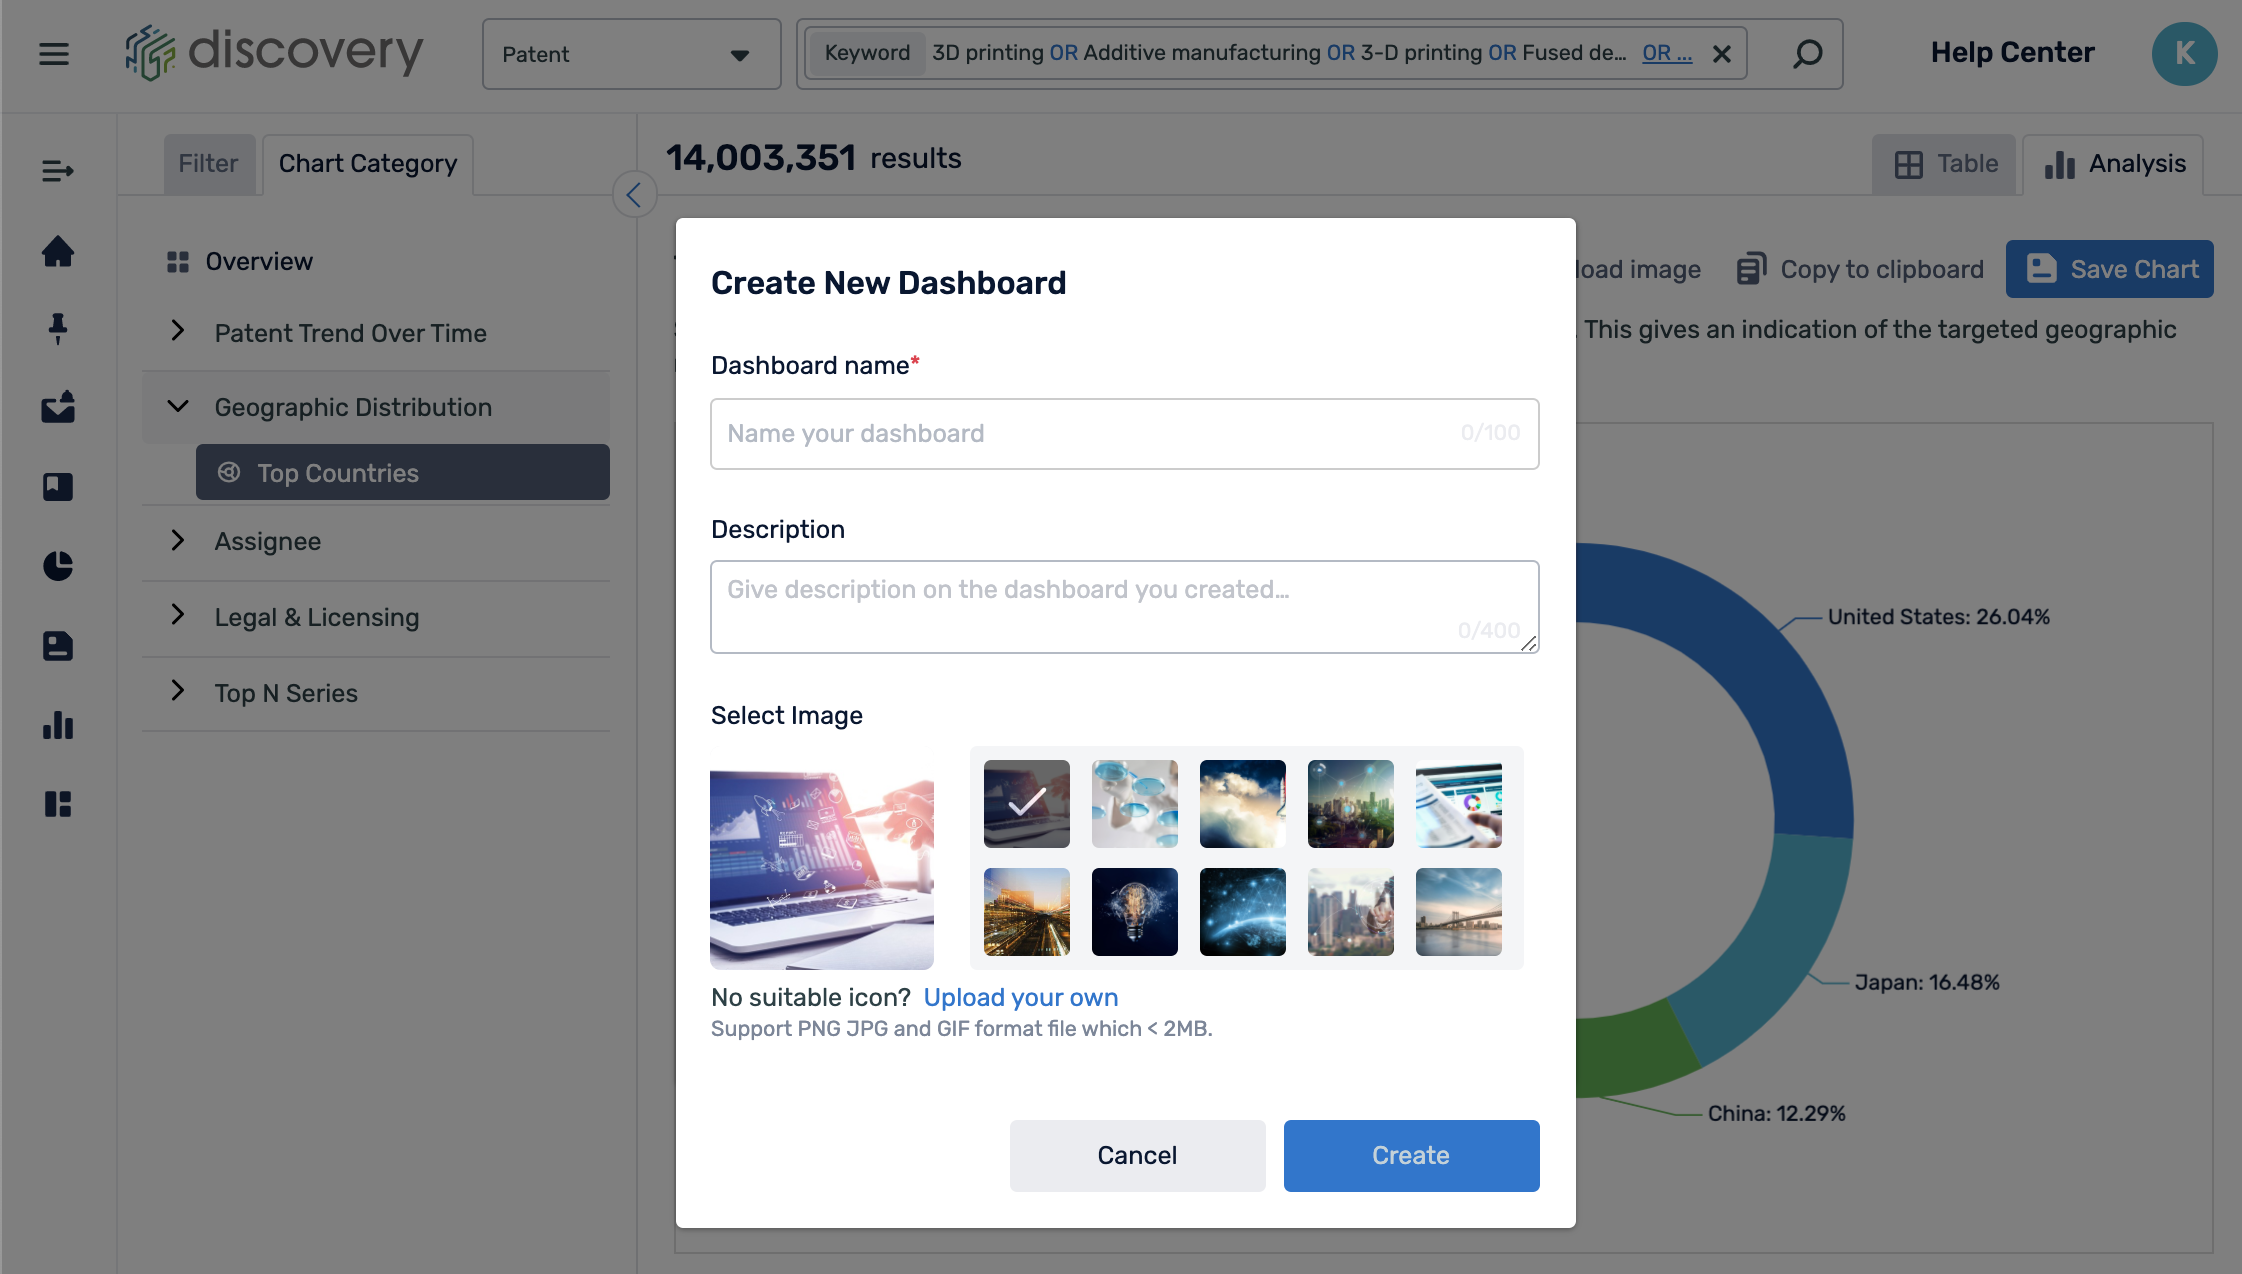
To create a new dashboard, click. "+ New dashboard". Here you can name your dashboard, add a description, and select an image for the cover photo. You can also upload your own image.
On the left-hand side menu, you can find all your created dashboards in "Dashboards". You can create a new dashboard, edit, delete, and view the contents of the dashboards.
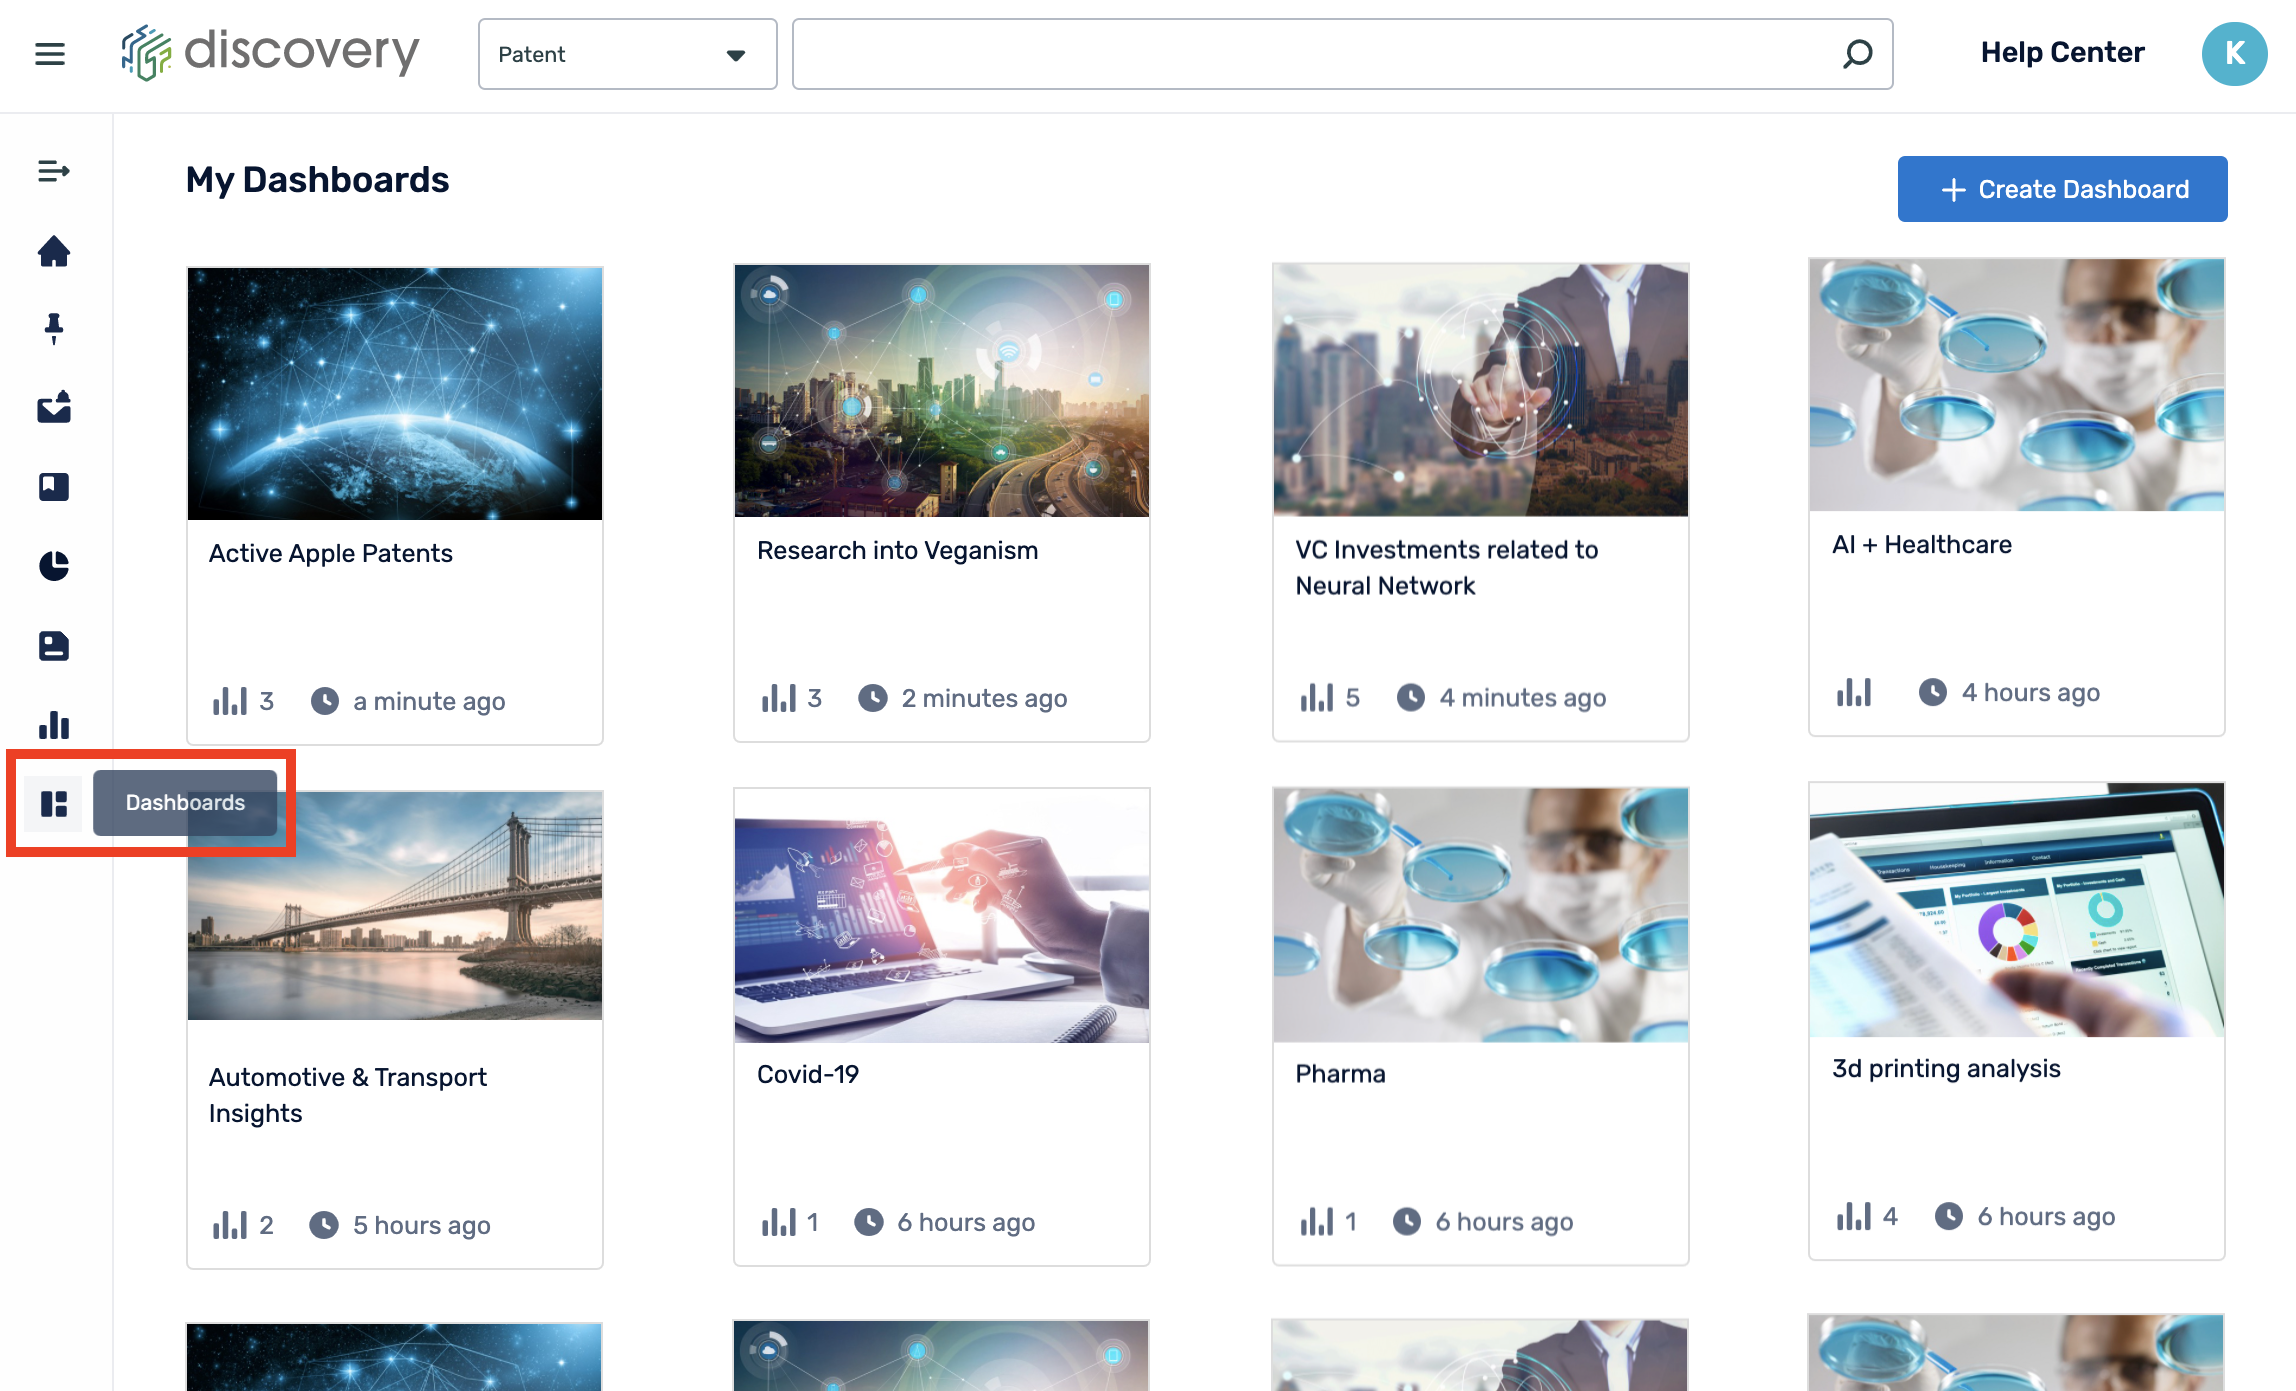
Hover over a dashboard folder to select the edit or delete icon. Information such as the date created, dashboard name, and the number of charts added is visible on the dashboard folder.

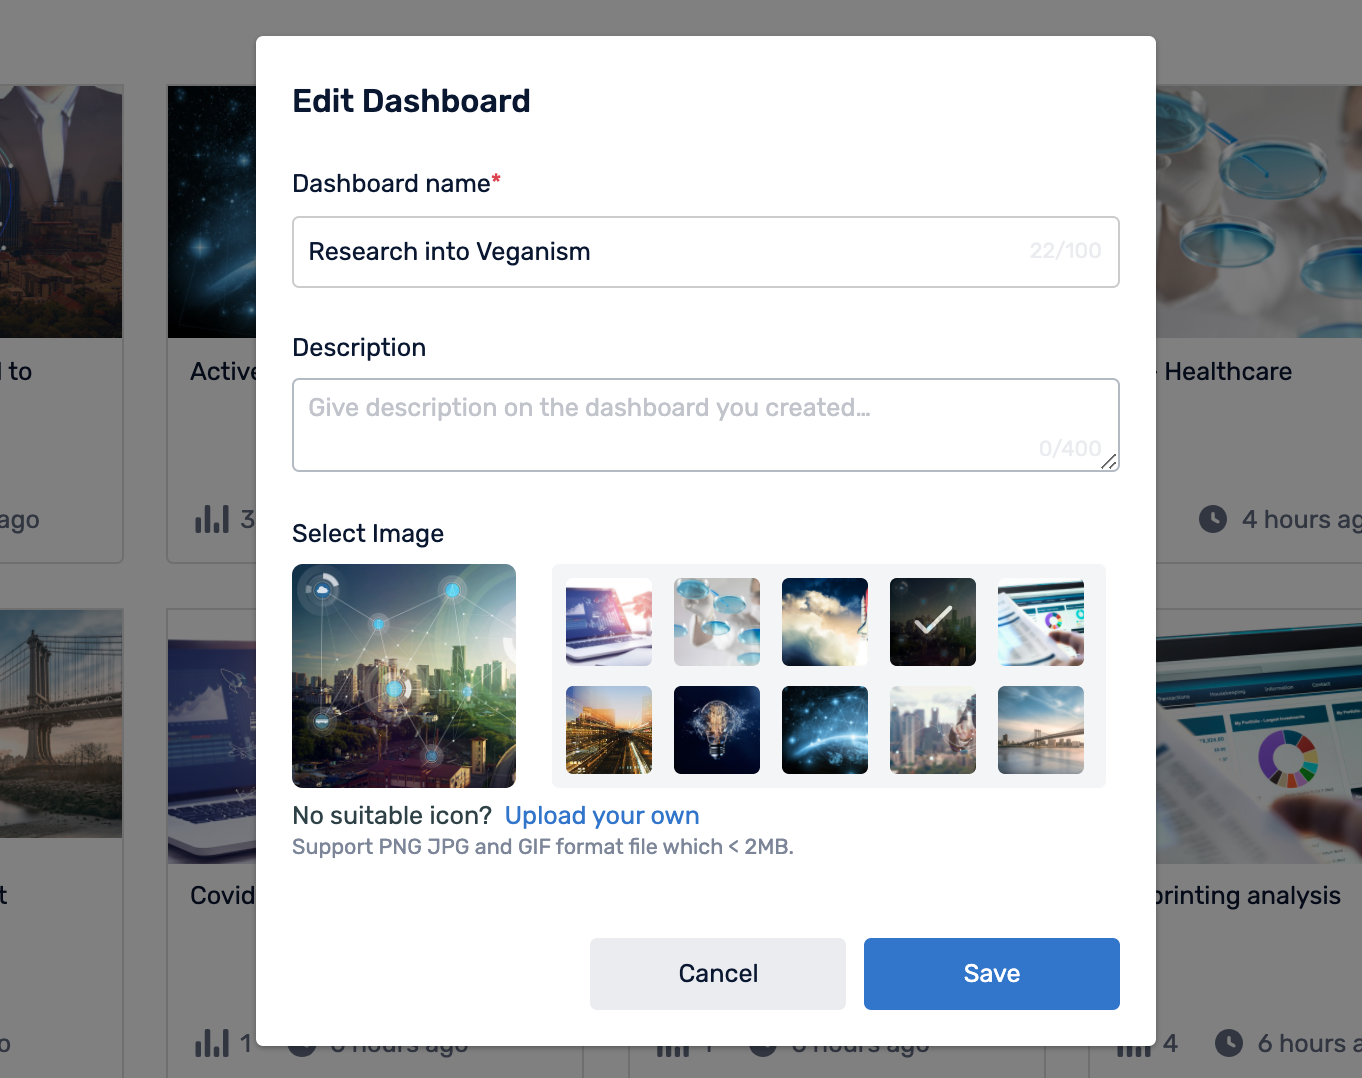
When clicking on the edit icon, you will be presented with this pop-up edit mode. You can change the name, description, and image of the dashboard.
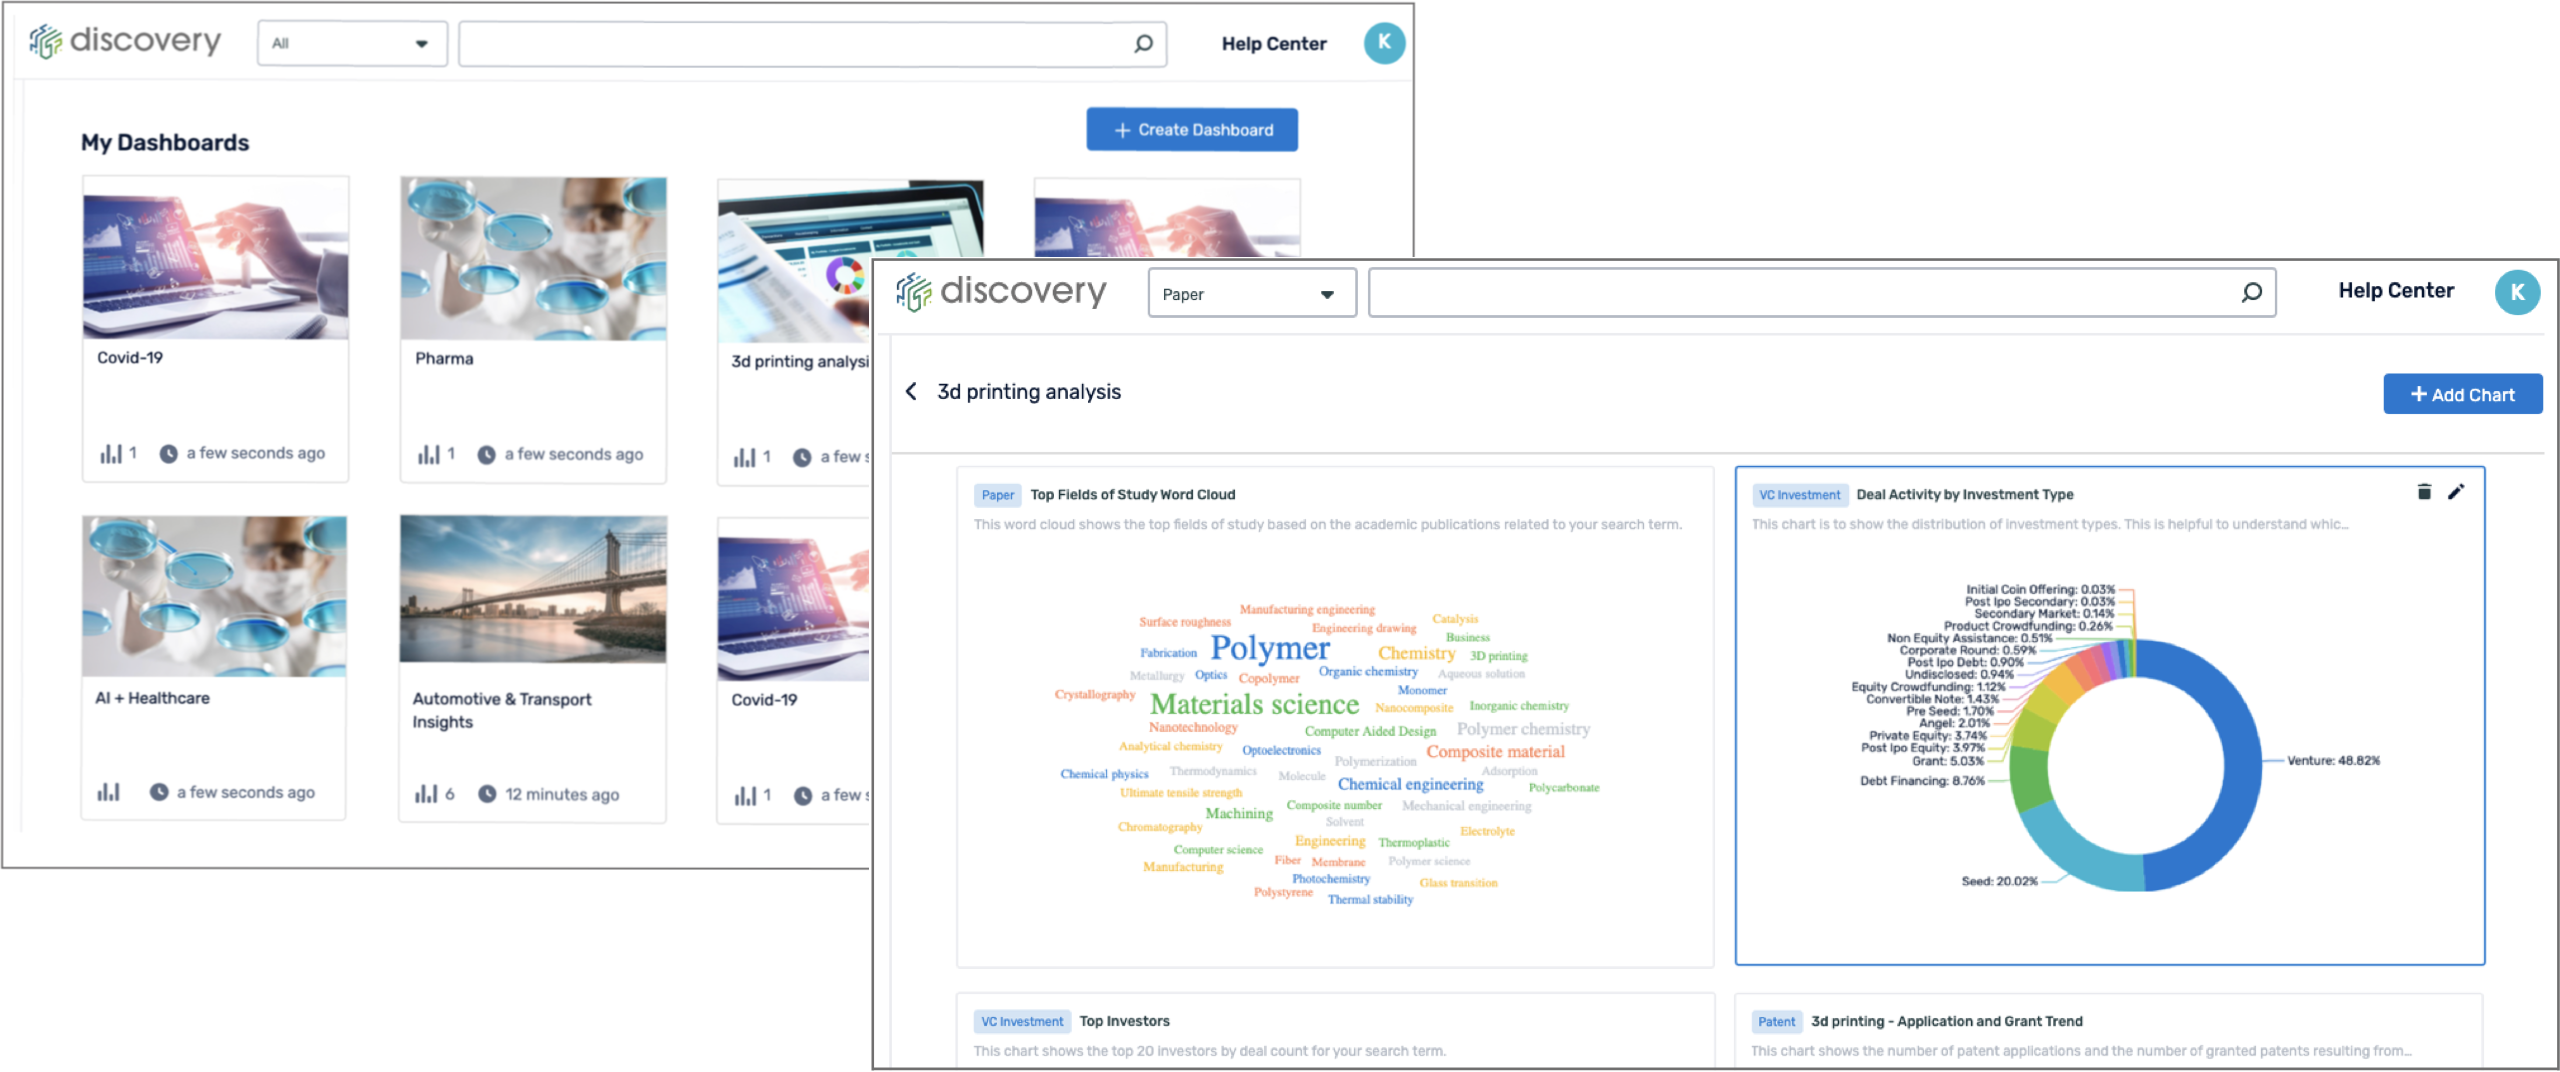
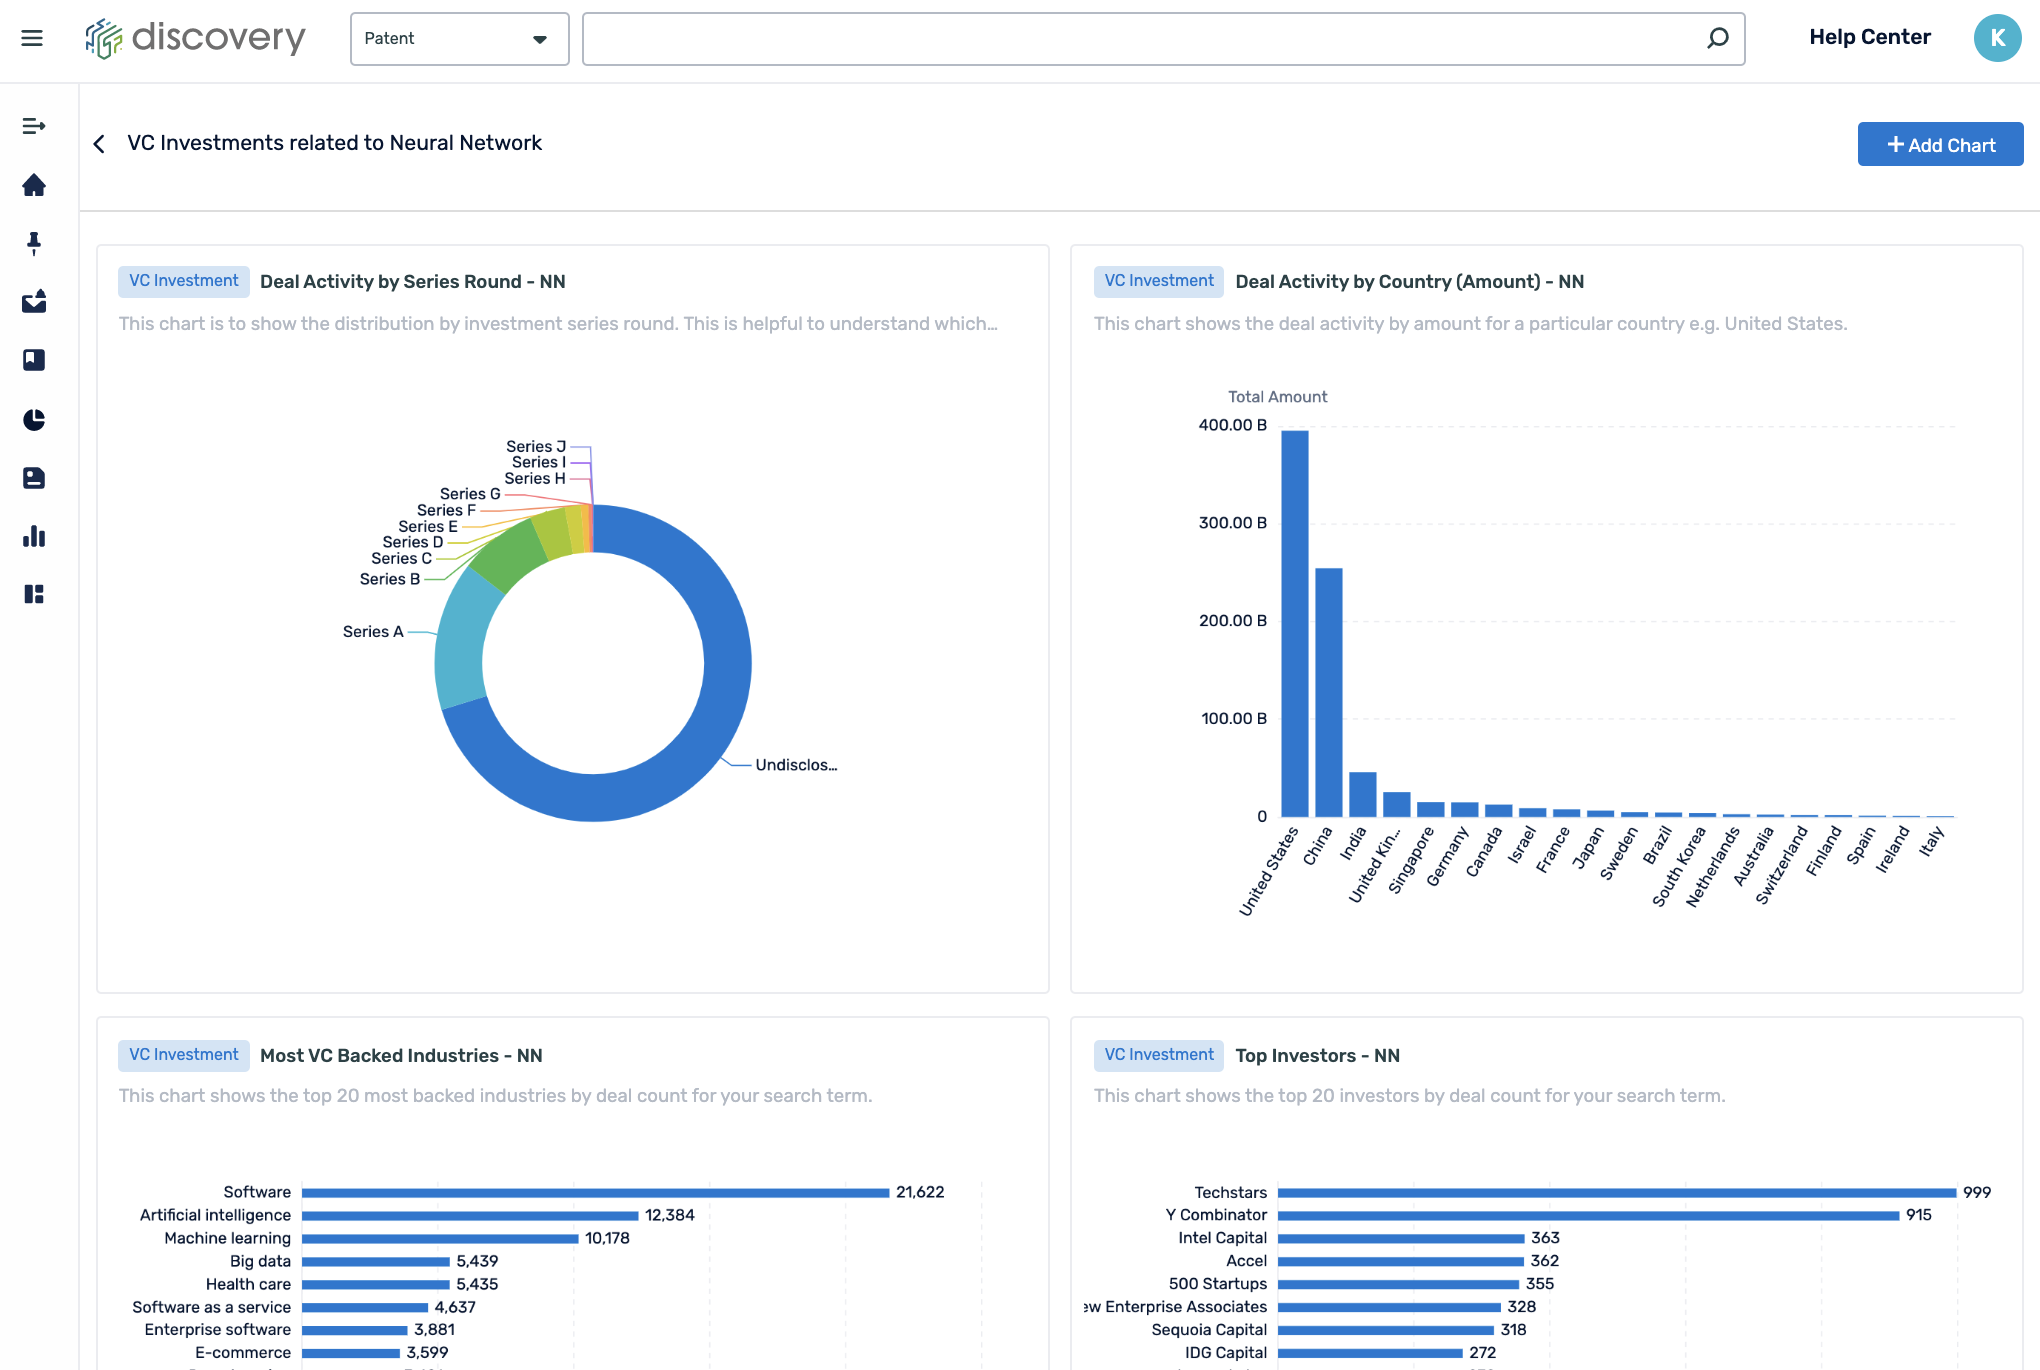
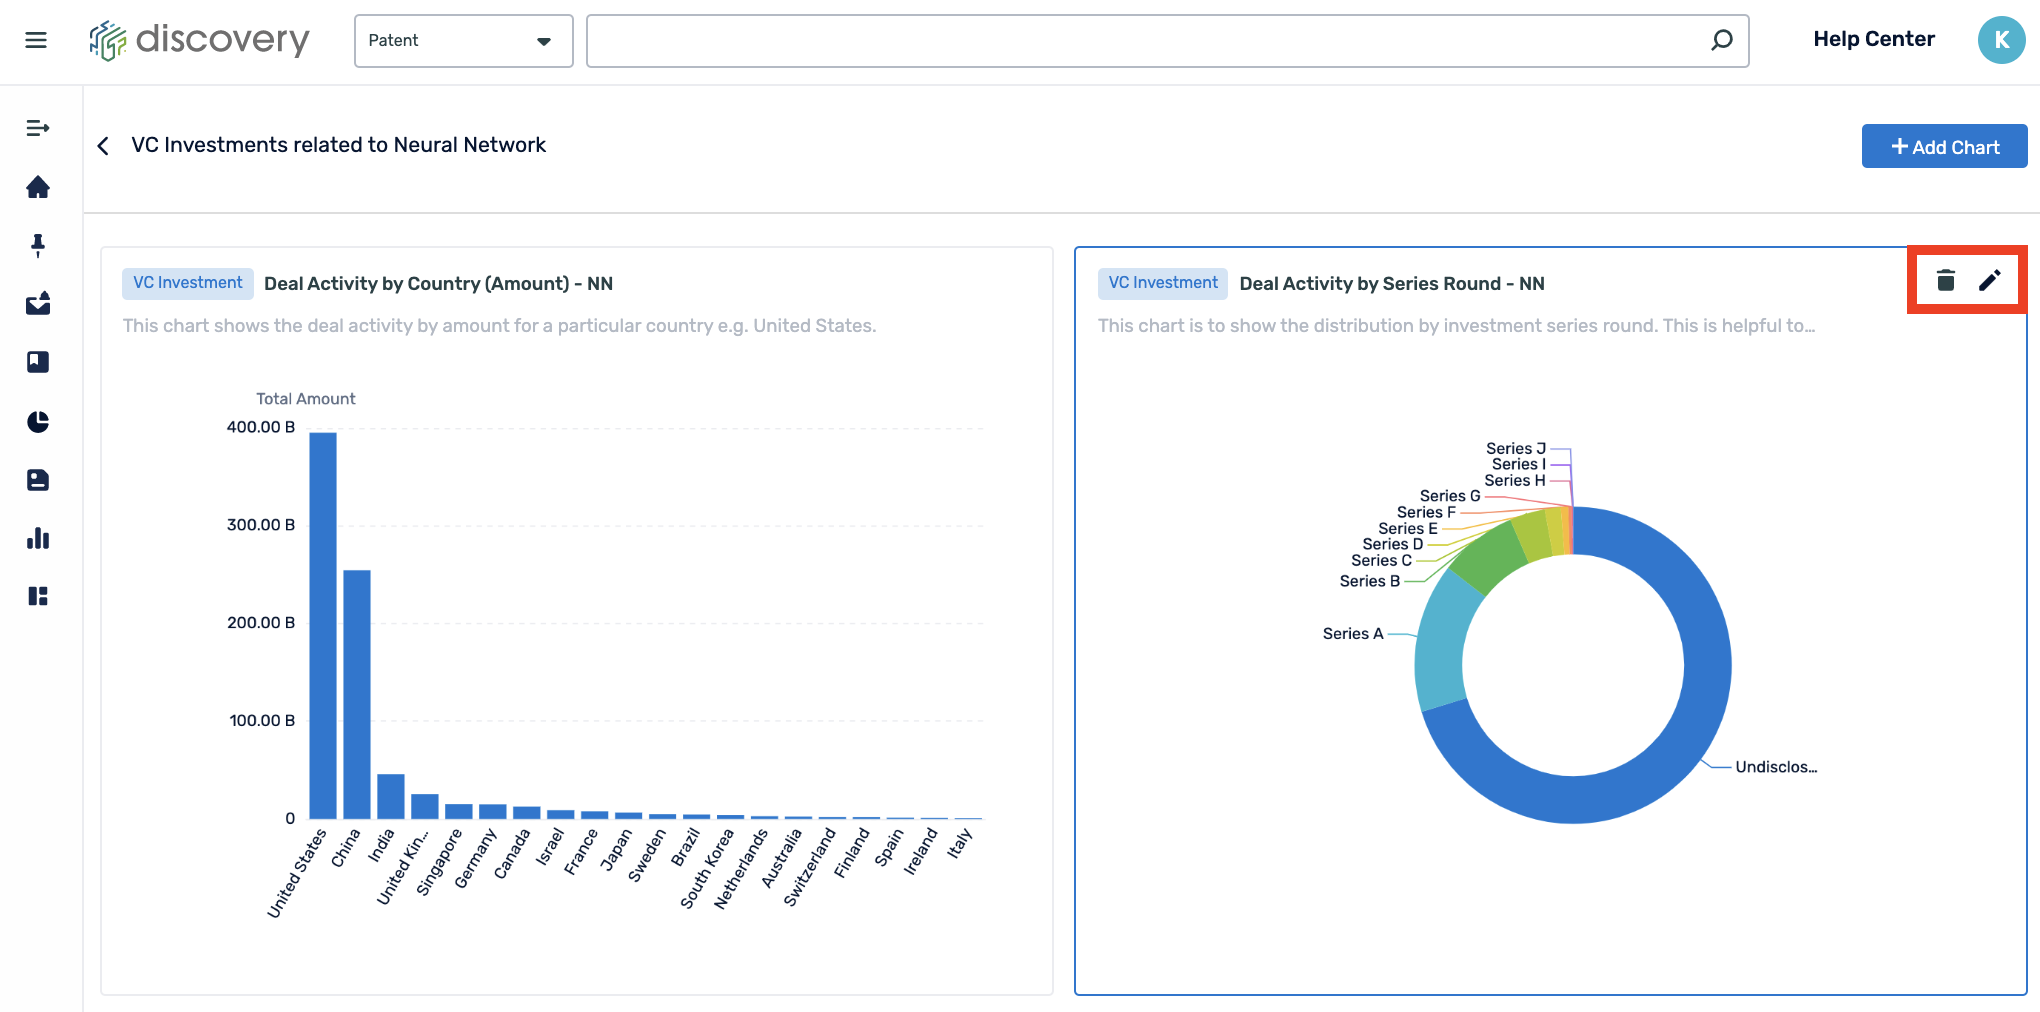
Click on a dashboard folder to view all of the charts within it. The data shown on the charts are real-time and automatically update according to any new results that are related to the search query and refinement filters set.
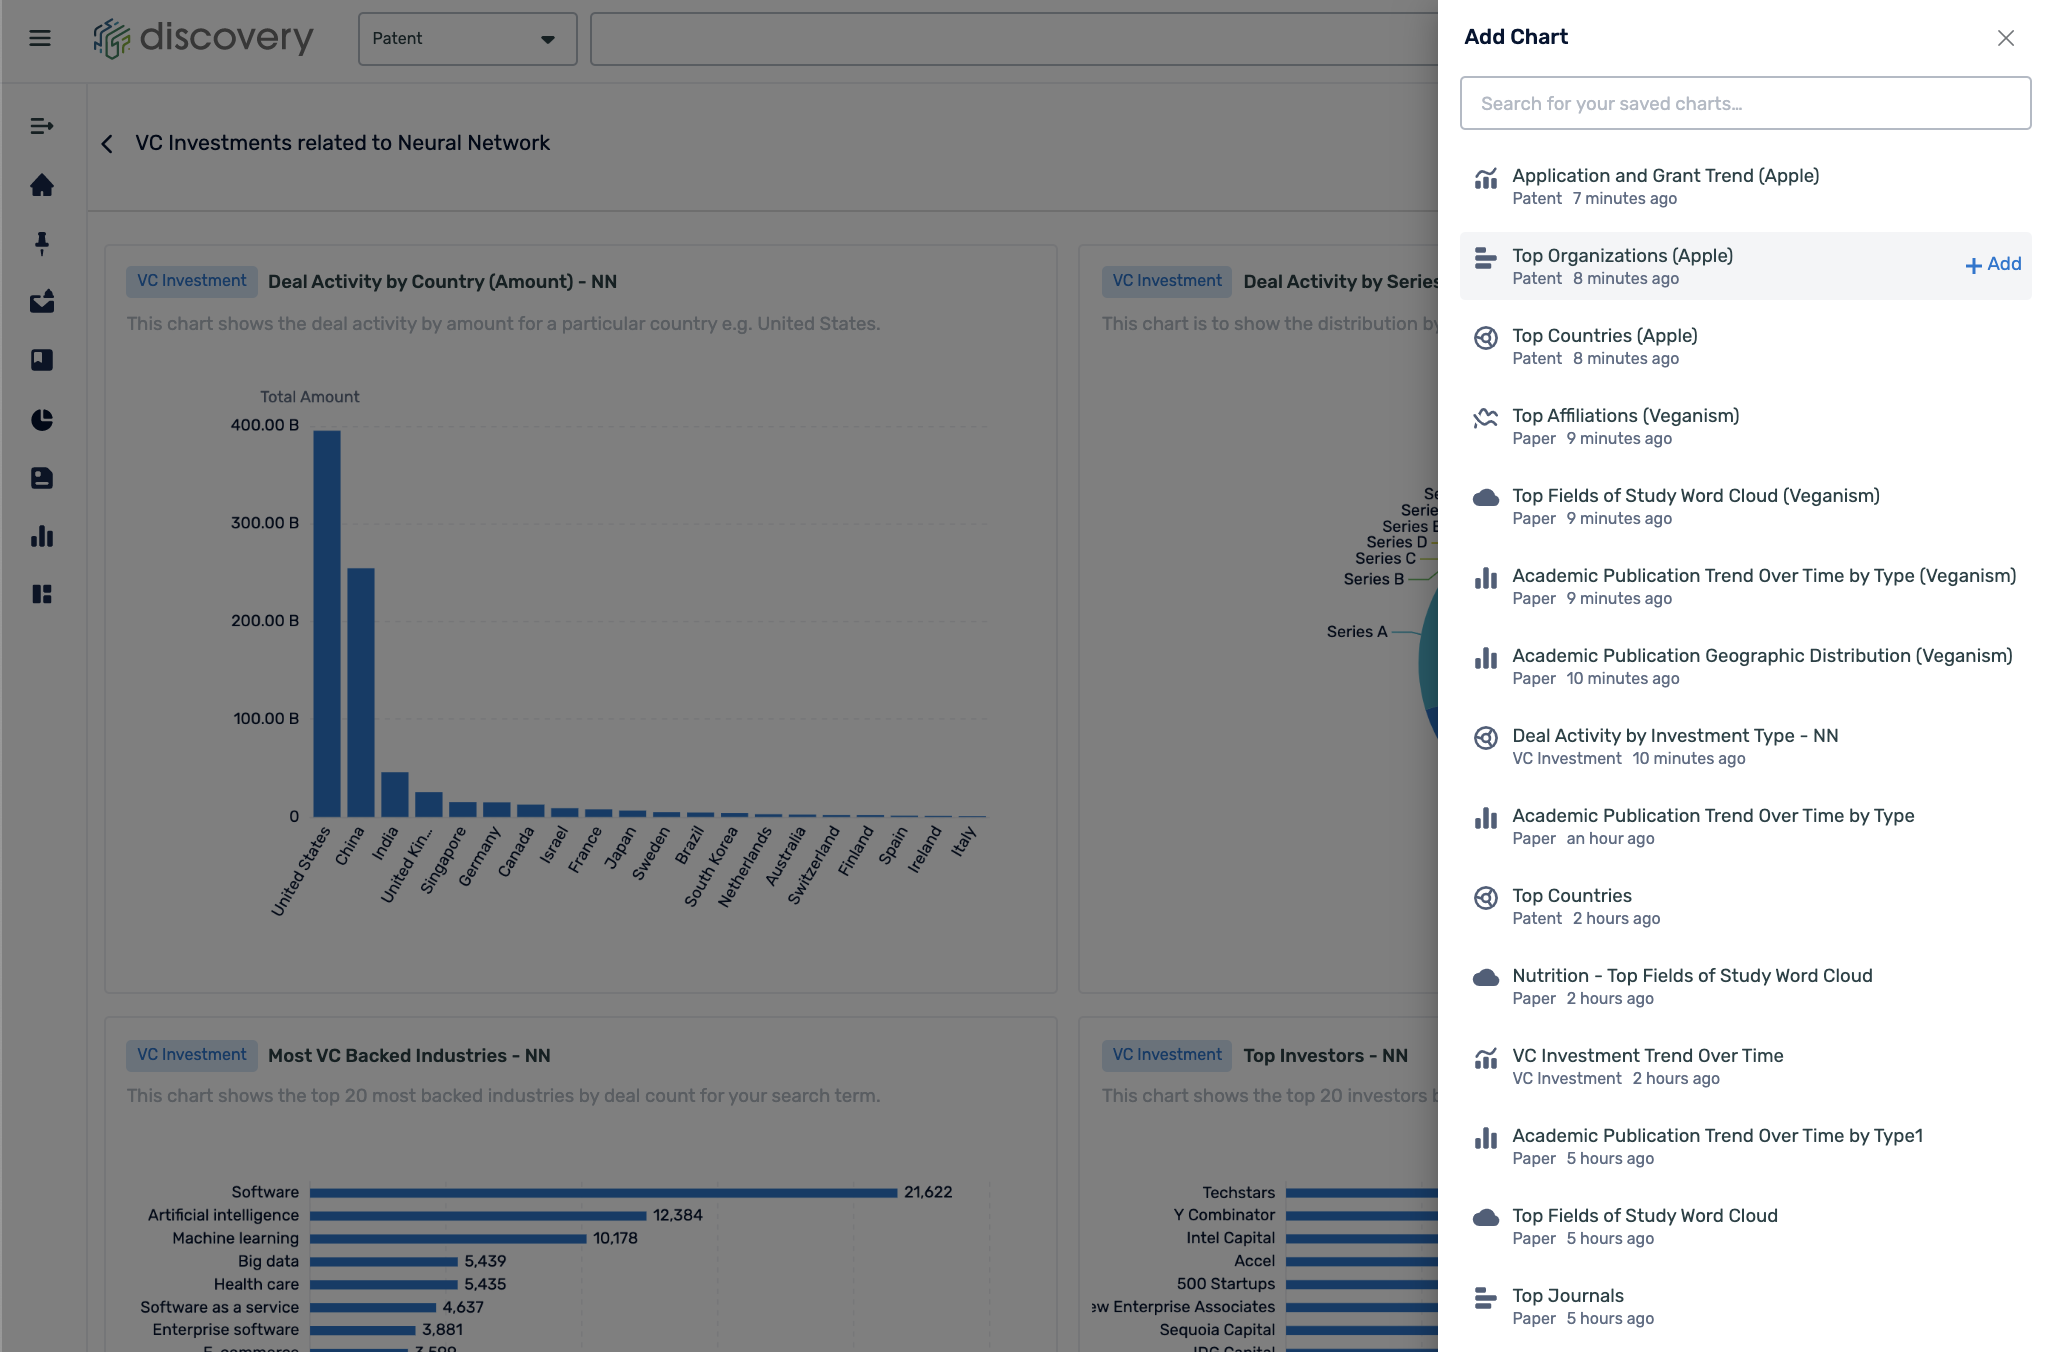
Clicking "Add Chart" in the top right-hand corner will allow you to add any charts that you have previously saved. On the right-hand side are all the charts you have saved previously, which can all be found on the saved charts page. Use the search bar to find a chart or simply select from the ones listed.
Hover over a chart to edit or delete any specific chart.
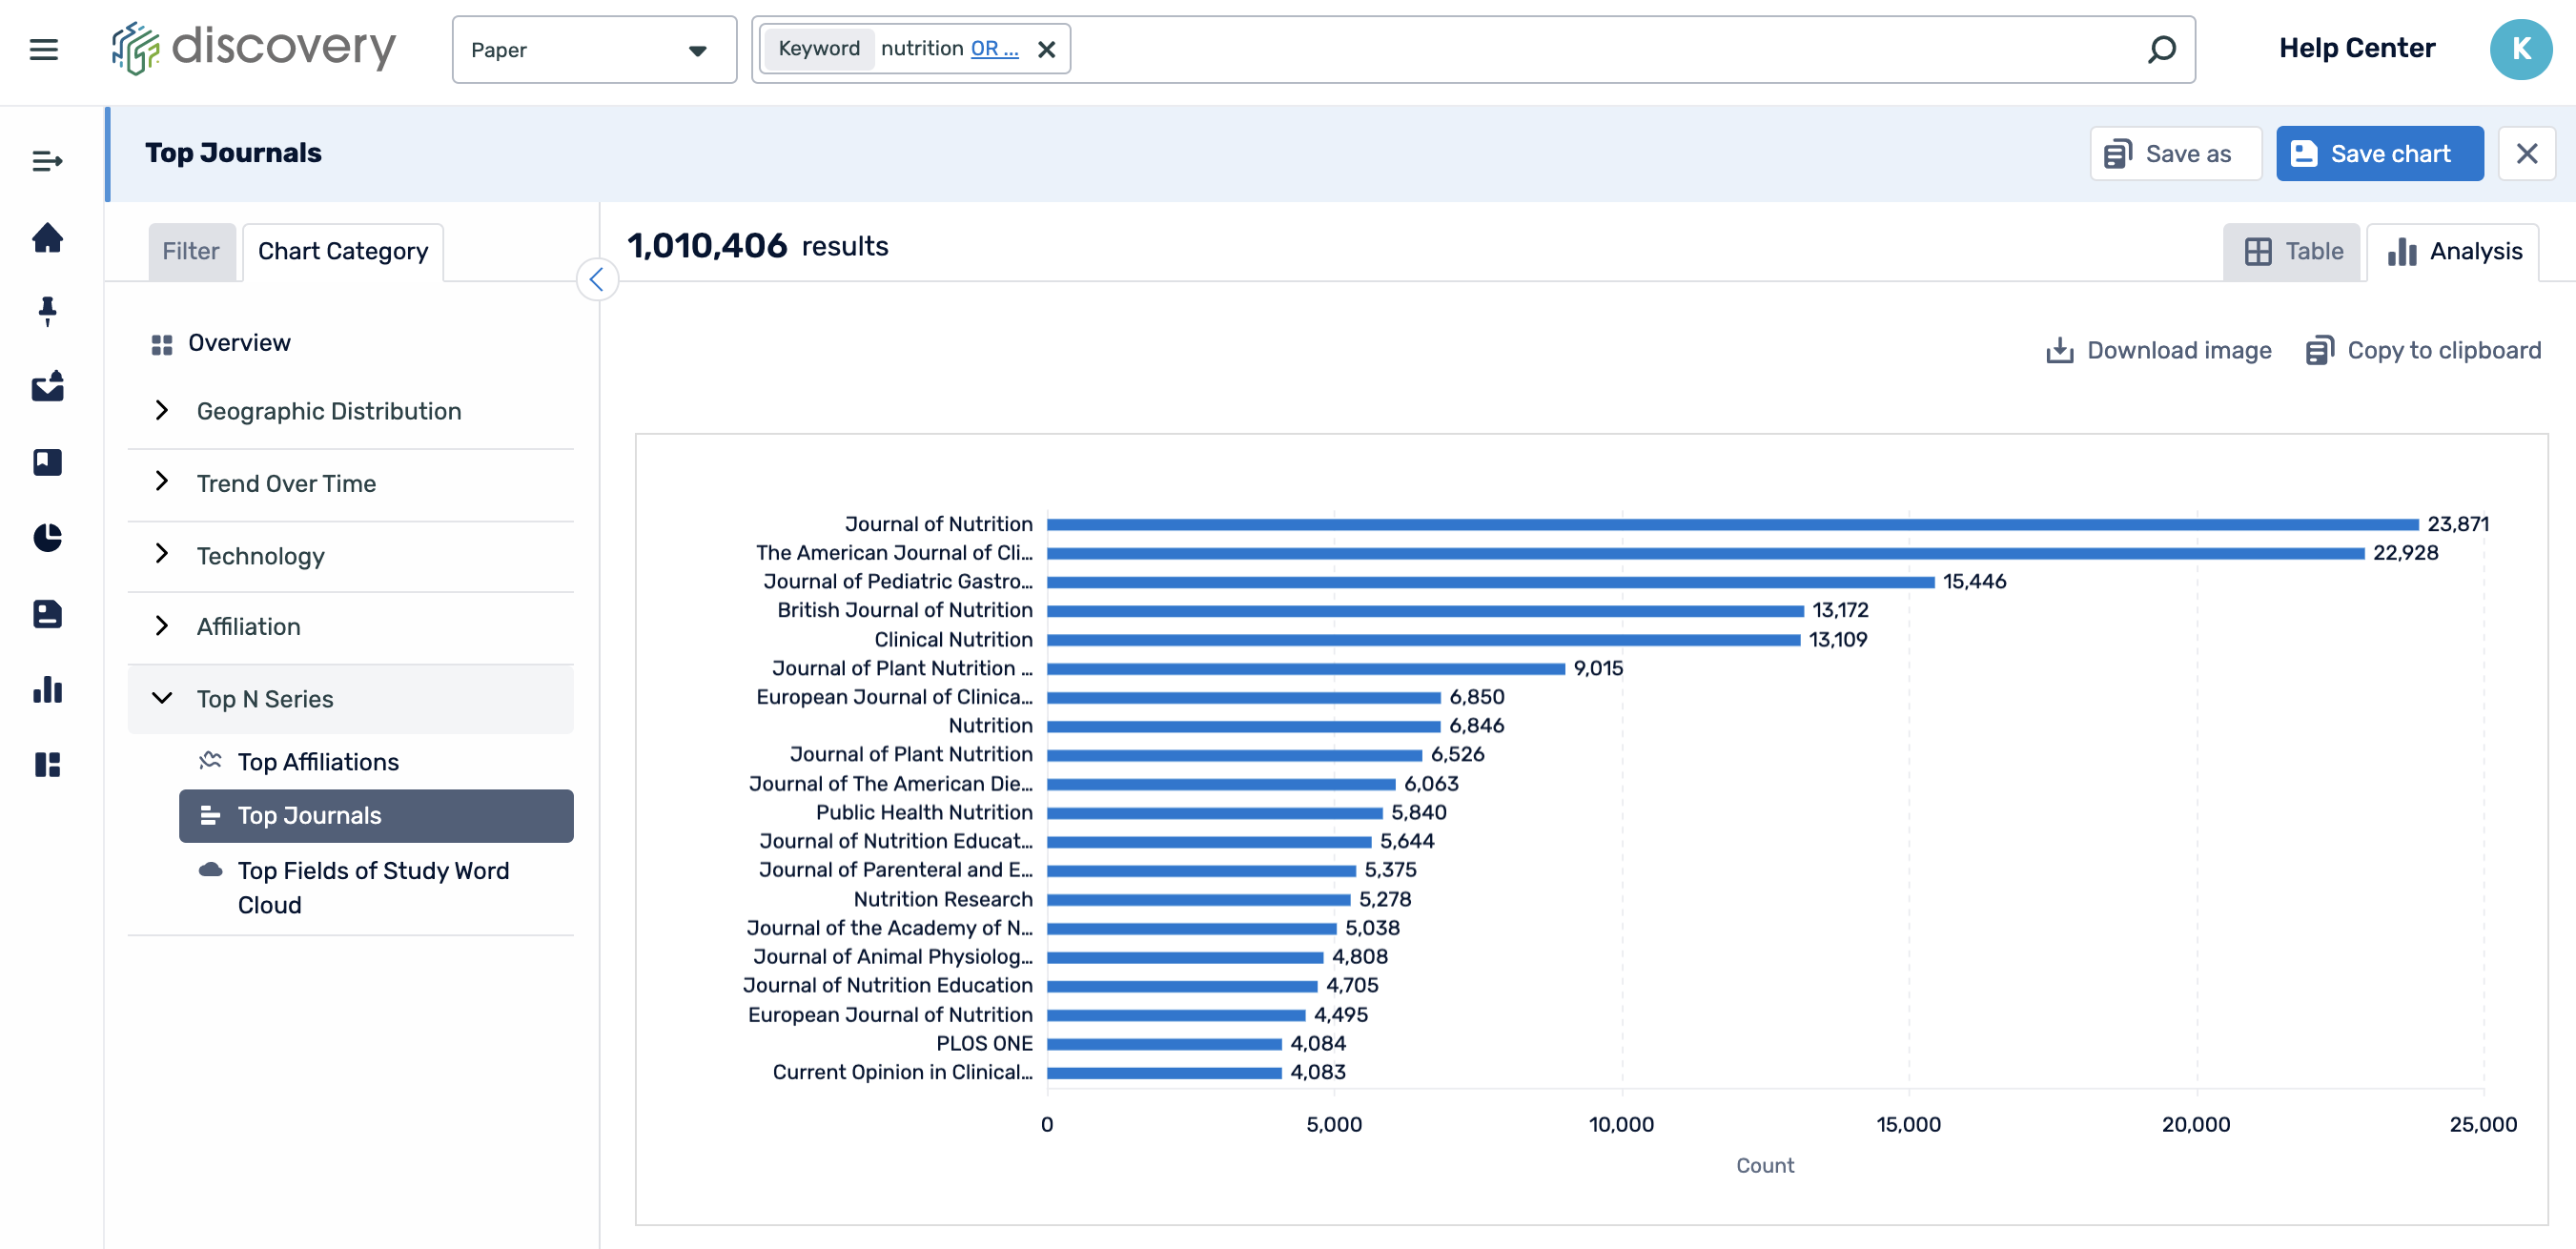
Clicking edit will bring you to this page where you can adjust your search query and refinement filters. You can then change the chart name, overwrite the existing chart by clicking "Save", and save another copy of the chart by clicking "Save As".
See GIF below:
10 pre-made technology dashboards
We have added 10 AI-powered pre-made dashboards, so you can quickly analyze the market trends of the top 10 technology areas being talked about this year. You can find these dashboards on the right-hand side of your homepage.
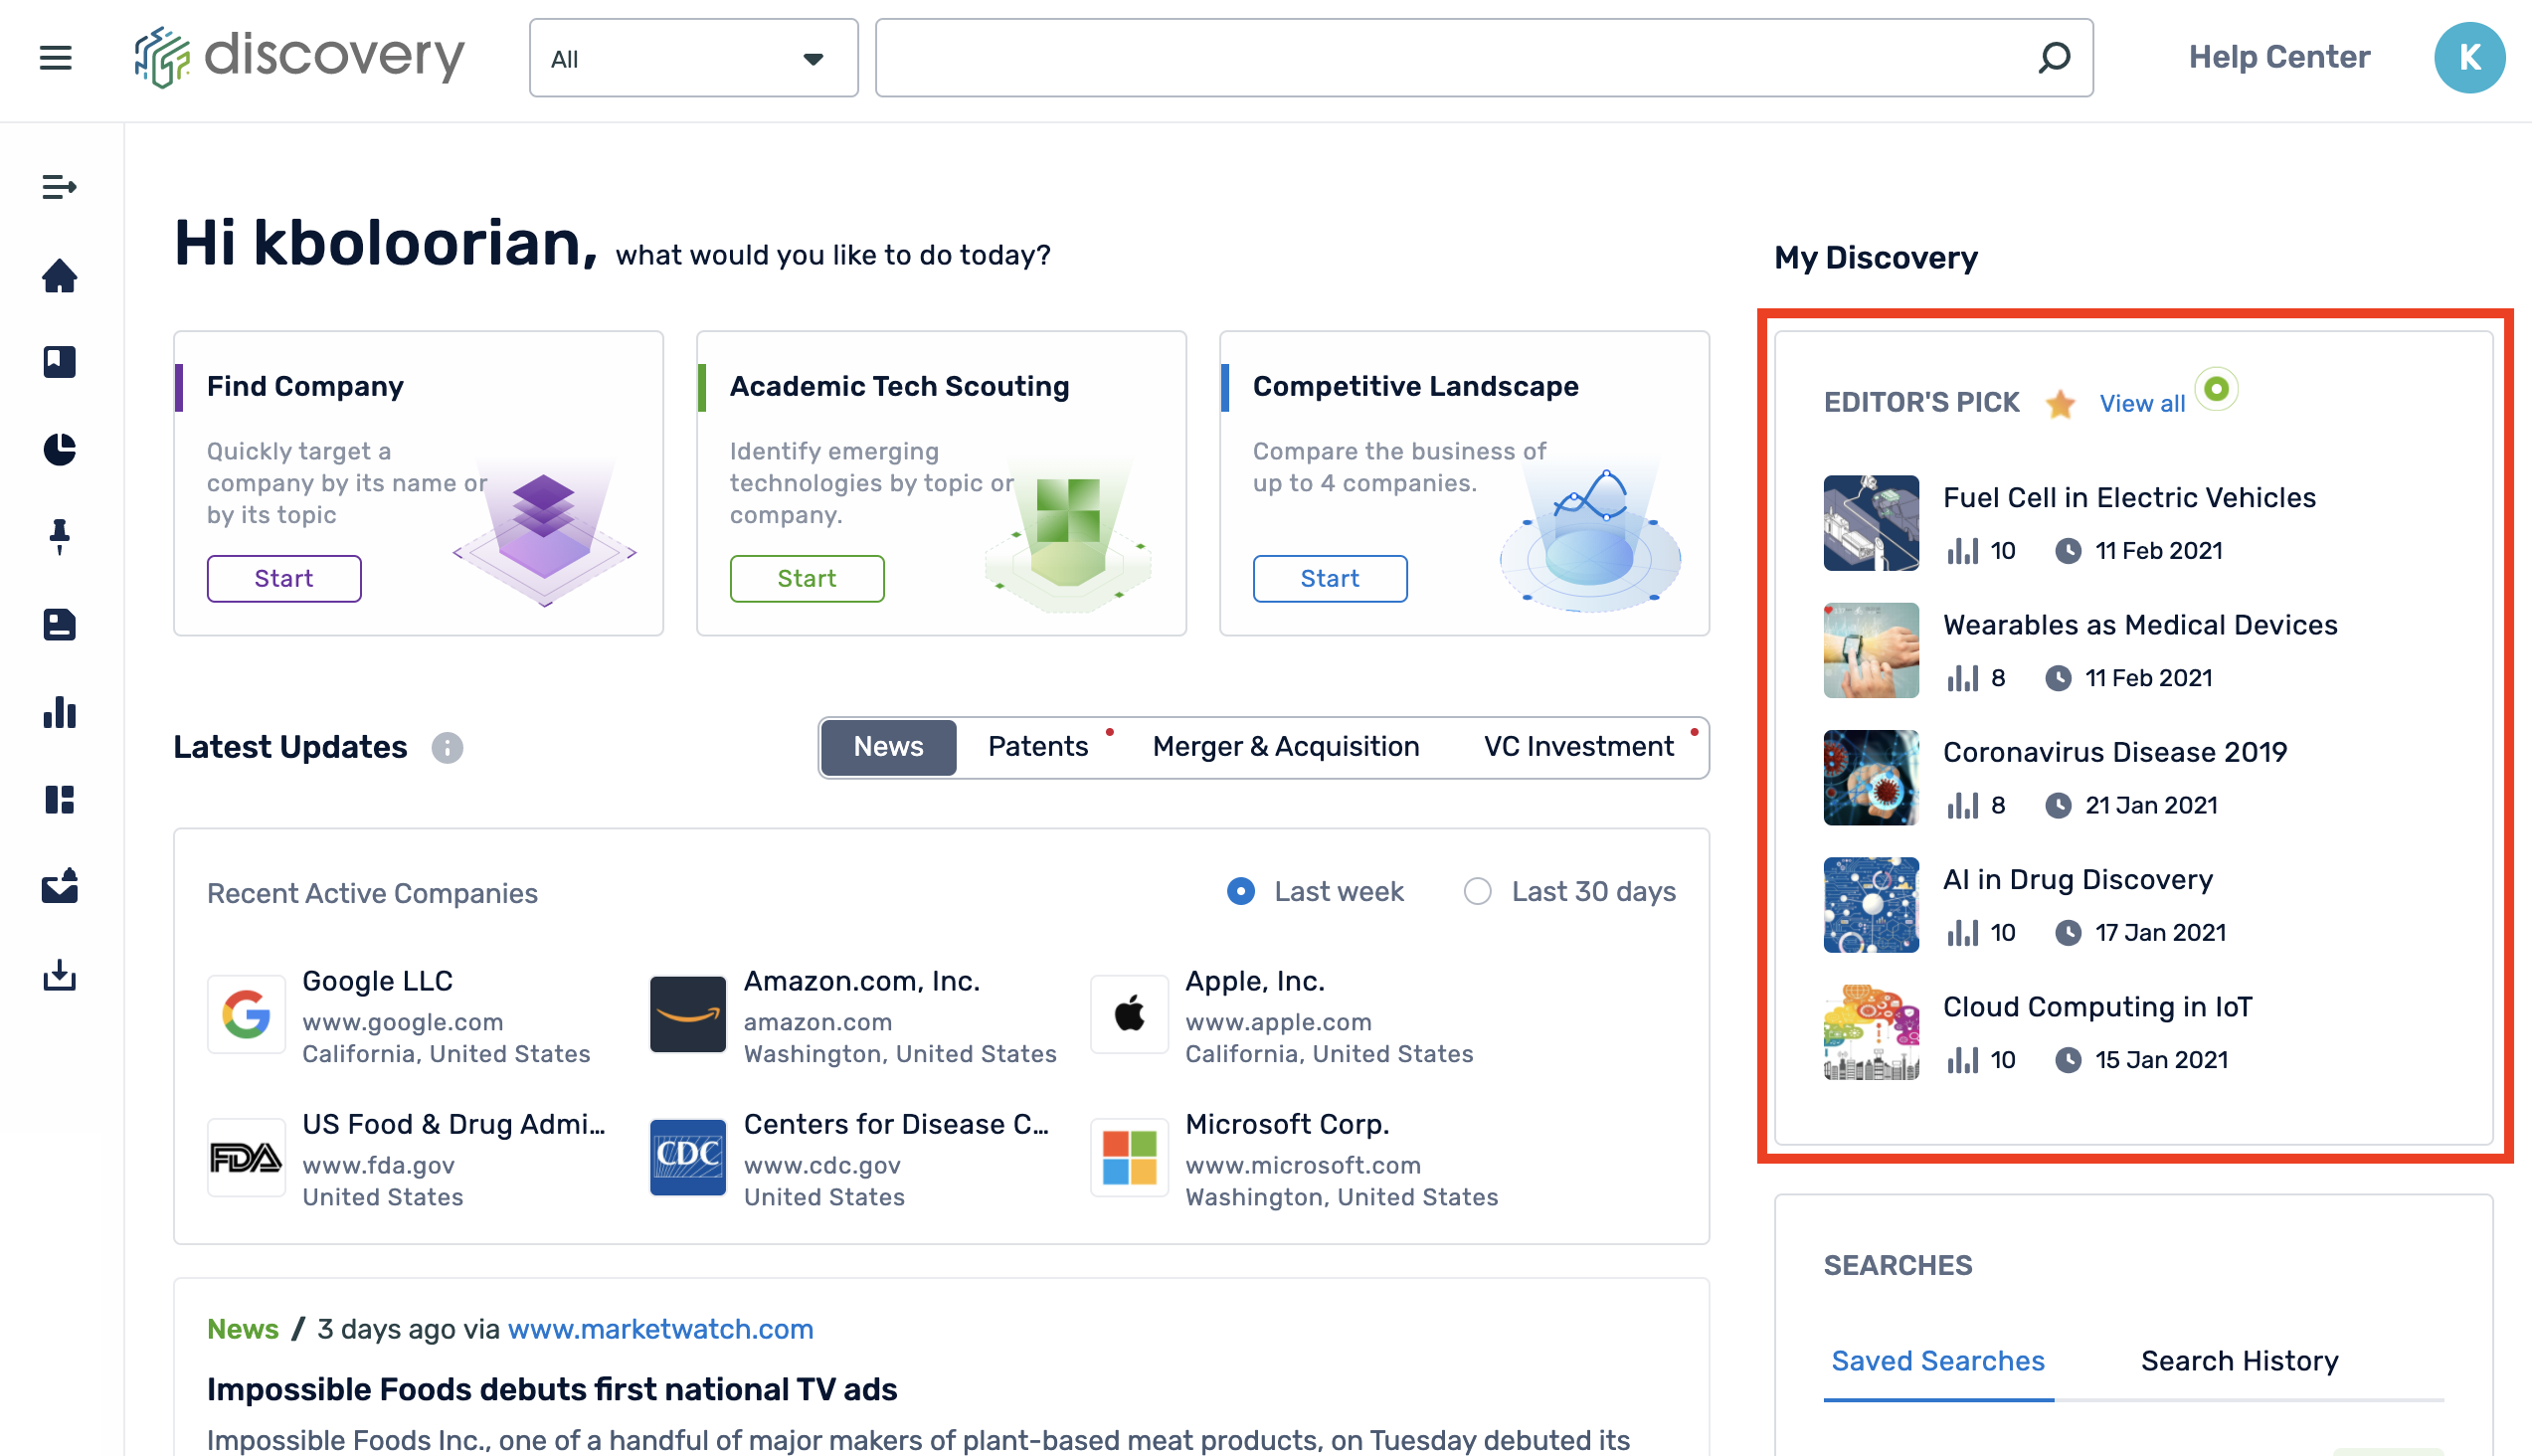
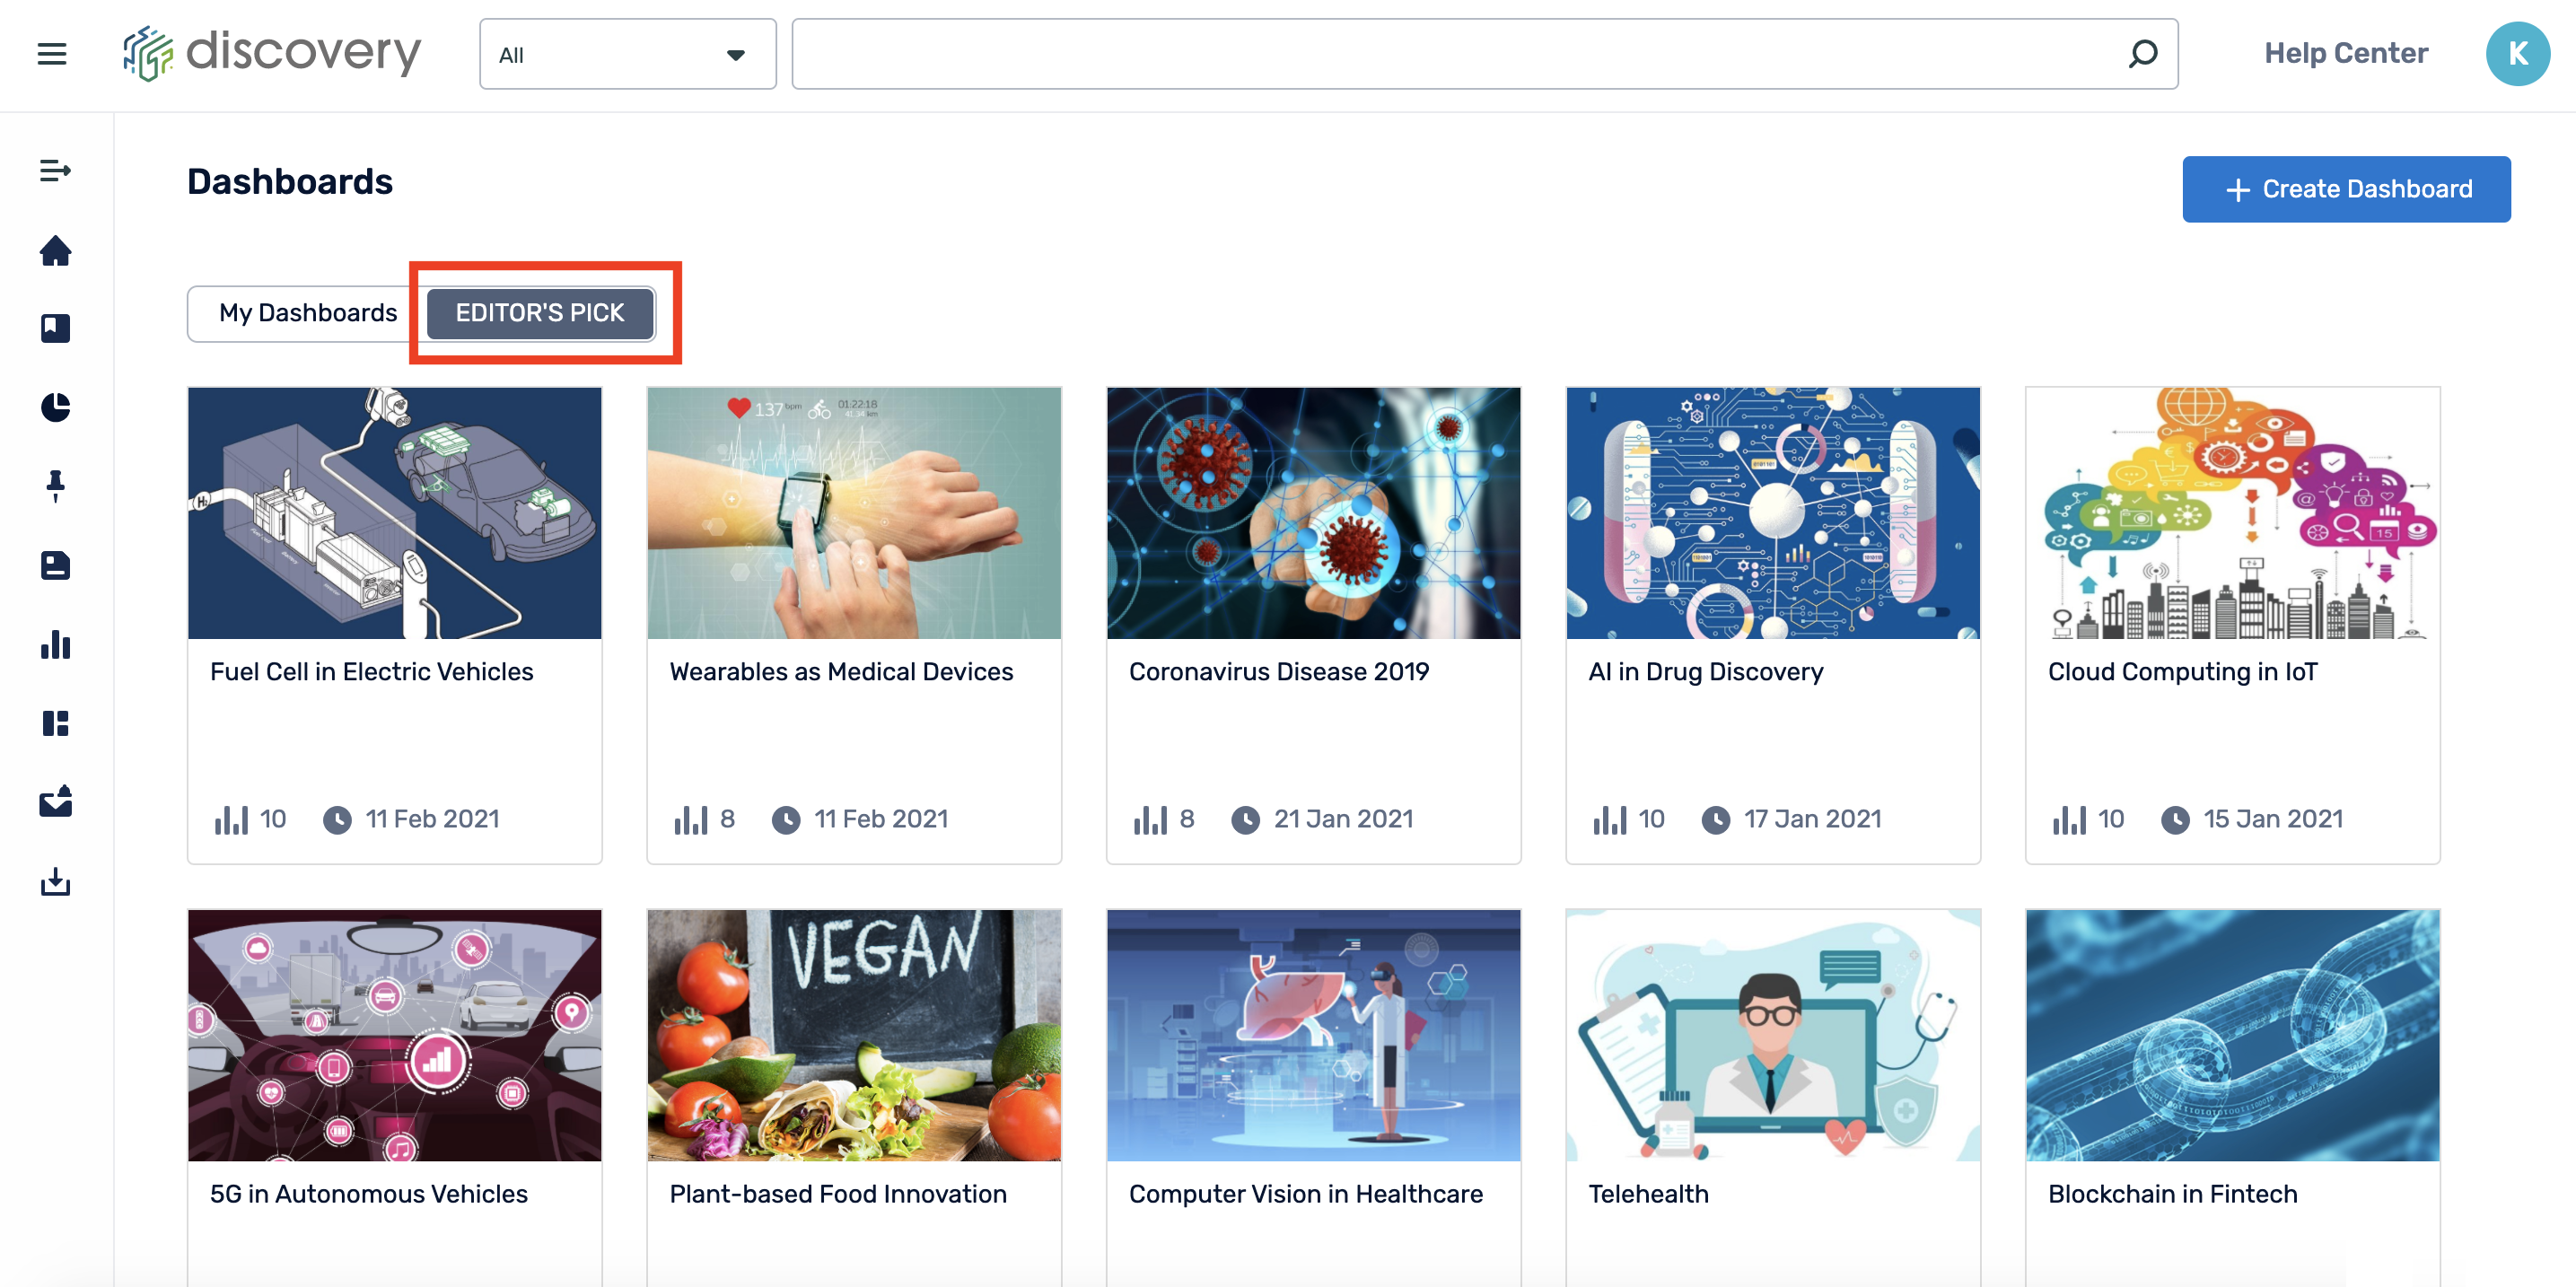
Clicking on the blue"View all" link will take you to the Dashboard page in Discovery. A new tab called "Editor's Pick" has been added where you will find all 10 of the pre-made dashboards.

Comments
0 comments
Please sign in to leave a comment.