Why Do Most Trend Graphs Seem To Dip In The Last Couple Of Years?
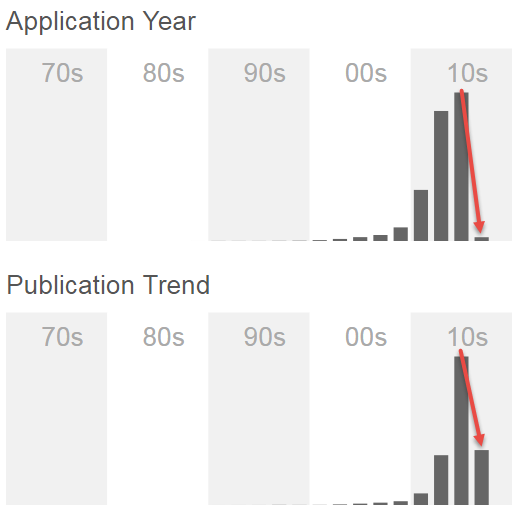
As you will see from the graph below, a lot of the graphs that are tracking application trends seem to dip as they reach the most recent couple of years. These charts tend to dip because applications can take a number of months to be made public, this can generally take around 12-18 months to occur.
Until these applications are made public they will not be registered on PatSnap. This is why we see a dip in the application amount as we near the last two years.
Was this article helpful?
Have more questions? Submit a request
Comments
0 comments
Please sign in to leave a comment.